
Keys to Effective Presentation: Graphical Illustration of Quantitative Data
How to graphically illustrate ratio analysis as a way to enhance and simplify summary findings.
A key to providing clients with effective valuation reports—and persuading jurors as an expert witness—is the ability to provide quantitative analysis in a compelling visual fashion. Here, Greg Gadawski and Darrell Dorrell provide an example of how to graphically illustrate ratio analysis as a way to enhance and simplify summary findings.
Financial analysis is a required element of virtually all valuation and litigation assignments. However, the quantitative analysis must be portrayed in a manner that conveys the same level of understanding gained by the preparer.
Therefore, this article contains an actual construction company’s financial analysis as a model for other valuation and litigation reports. The client name, of course, is blinded along with other modifications protect the client’s identify. Nonetheless, we have provided an example that simultaneously completes a quantitative analysis and that is visually illustrative.
[pullquote]“The financial analysis skills applicable to solvency analysis and valuation engagements are critical to a thorough understanding of the entity being examined.”[/pullquote]
The analyst can draw observations and conclusions from the data, and the client can easily discern the logic behind such a decision. The suggested financial analysis format follows.
For illustration, we have included a graphical presentation of the results of several of our analyses. Space precludes presenting graphs for all of the calculations, but analysts are encouraged to utilize this method to enhance the understanding of the audience for whom the analysis is prepared.
Financial Analysis Results of Operations
The following indicators were derived through analysis and review of the Sample Company’s (Sample Co.) financial statements and related documents. All of the ratios illustrated below were derived from the company’s normalized financial statements.
In general, Sample Co. experienced remarkable revenue growth in 2001 due to a sizeable increase in the company’s minority and related set-aside programs.
Other important considerations in the overall observations of Sample Co.’s financial performance are as follows:
- The Company’s gross profit margin returned from a low of 11.2 percent experienced in the year 2000 to an average of 17.9 percent in the year 2001. This approximates the historical average gross profit margin for Sample Co.
- Sample Co.’s net income in 2001 was more than double that achieved in any of the prior four years resulting in a 180 percent increase in shareholder’s equity.
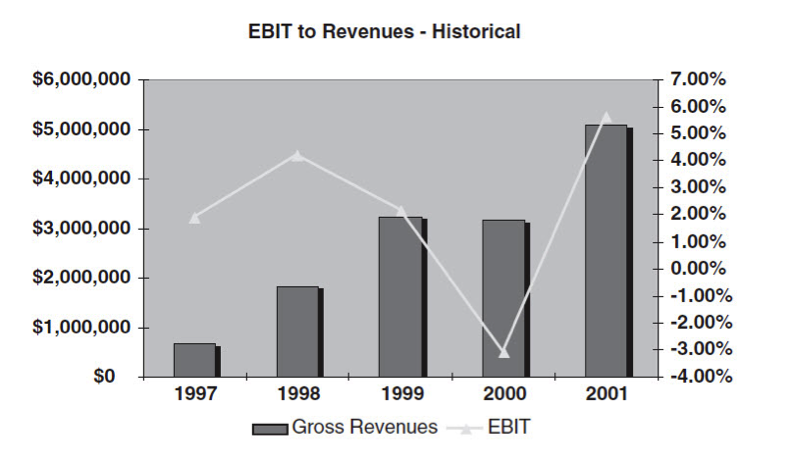
The company’s sales have grown rapidly from $661,032 in 1997 to $5,088,773 in 2001. In fact, revenues for 2001 increased more than 60 percent from those obtained in the year 2000.
As illustrated below, the company’s EBIT/Revenues relationship (earnings before interest and taxes as a percent of revenues) rebounded well in 2001. This is attributable to the increase in sales coupled with the return to a normal gross profit percentage.
When compared to the industry and similar companies in the Pacific Northwest, Sample Co. falls within the relevant range of performance for most key indicators.
Sample Co.’s financial ratios are summarized in this section and are analyzed by observing the trends over time (time-series analysis) in comparison to itself and to the industry. Analyzing trends in ratios can give indications as to whether a company’s financial condition is improving or deteriorating. Likewise, further analysis is achieved through horizontal and vertical analysis using common-sizing techniques.
The Risk Management Association (“RMA”) publications provide ratio analysis by Standard Industrial Classification (“SIC”) code. Throughout our analysis, the data and information referred to as “Industry” is based on the information gathered from RMA (which, however, is not statistically valid), utilizing the SIC 1623 (Contractor –Water, Sewer, Pipeline, Communication & Power Line Construction). We recognize that the industry data may not be truly comparable as Sample Co.’s operations span more than one SIC. As a result, our analysis rests heavily on trend analysis and related techniques.
Liquidity
Liquidity ratios indicate the company’s ability to meet its current obligations. In general, the higher the ratio, the greater the company’s liquidity.
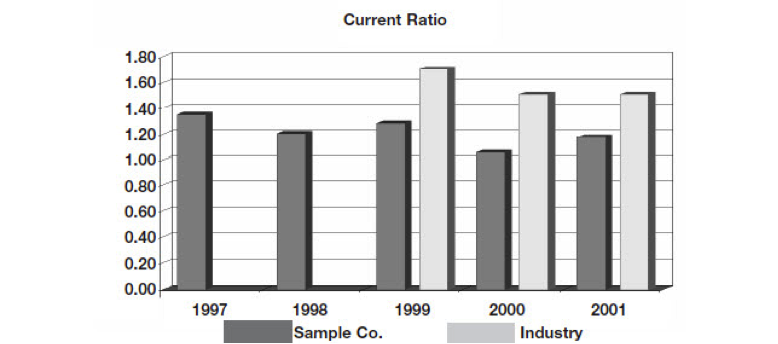
The Current Ratio (current assets divided by current liabilities) is the most commonly used liquidity ratio. As illustrated in the graph below, Sample Co.’s current ratio has remained fairly stable for the past five years and has fallen slightly below the industry average data available from 1999 forward.
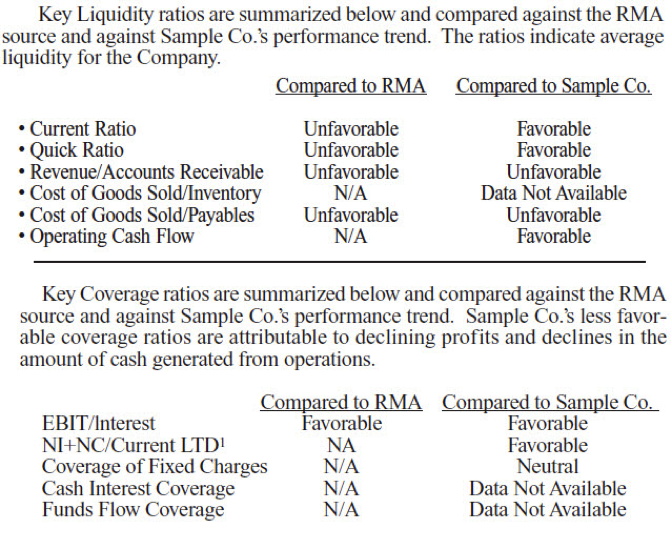
Coverage
Coverage Ratios indicate the degree to which a company has “covered” its leverage requirements, i.e., debt load of interest expense.
One of the key coverage ratios is EBIT (earnings before interest and taxes) to Interest. Sample Co.’s EBIT to Interest Ratio well exceeded that of the industry for the year 2001. This is a direct result of the company’s positive growth in earnings for the year.
All other standard, financial ratios should be evaluated and presented as well. Both a graphical and tabular presentation will assist the analyst in conveying his knowledge and understanding of the subject Company, and allow the user to follow the development of the conclusions reached.
The remaining categories of analysis include ratios indicating:
Leverage: Leverage Ratios indicate the degree to which a company’s capital structure is financed with debt. The higher the ratio, the more risky the company. The ratios to consider include Debt/Net Worth, Total Debt to Total Assets, L/T Debt to Total Capital, and Total Debt Ratio.
Operating or “Efficiency” Ratios measure the efficiency at which a company is utilizing its assets with revenue as the numerator and a measure of assets as the denominator. Generally speaking, the higher the ratio, the more efficient its asset utilization. The ratios to consider include inventory turnover, fixed assets turnover, and total assets turnover.
Working Capital Ratios measure the efficiency at which a company manages its working capital. In general, except for Days Payable Outstanding and Days Working Capital, a negative change in the Working Capital Ratio signifies improvement. The ratios to consider include Days Sales Outstanding, Days Payable Outstanding, Days Inventory Outstanding and Days Working Capital.
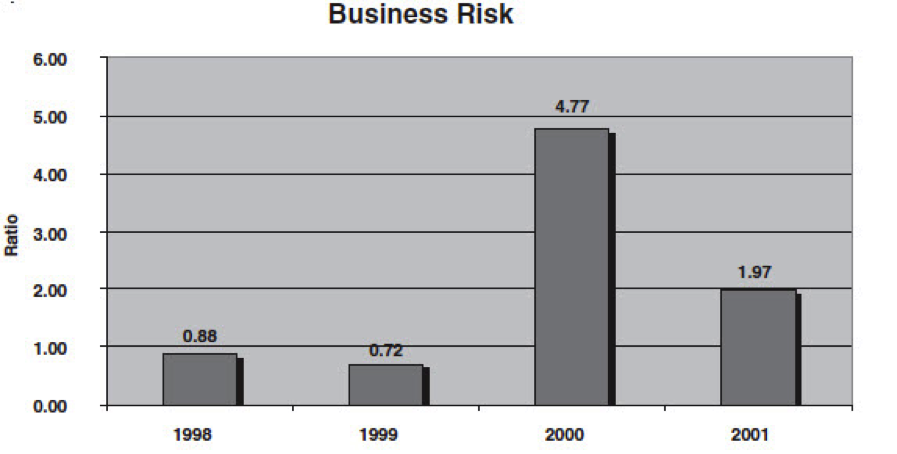
Going Concern: Risk ratios ascertain the uncertainty of the income flows to the company’s various capital suppliers whereas Going Concern Ratios measure the company’s ability to meet future cash commitments. The information to consider includes the Business Risk Ratio, Degree of Operating Leverage, Degree of Financial Leverage, and Total Free Cash. A discussion of the Business Risk Ratio follows.
The Business Risk Ratio (standard deviation of net income divided by the mean of net income) measures the degree of fluctuation of net income over time. Ratios closer to zero typically signify more stability in the company’s earnings. The Business Risk Ratio for Sample Co. is illustrated below and depicts a company experiencing volatile earnings. Further consideration of the Business Risk Ratio may be warranted when developing your conclusion and conveying that conclusion to the ultimate user of the analytical results.
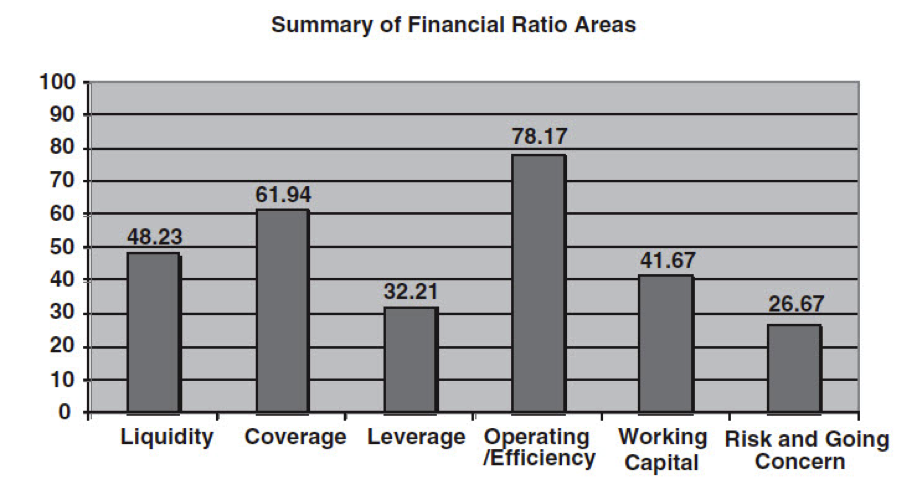
Summary
Presented below is a summary of all the typical valuation financial ratios by category of measurement. The percentile scale is from 1 to 99 with higher values representing better performance in that ratio area. The figures are based upon the weighted average of each individual ratio within the category of measurement.
Sample Co. Conclusion
Overall, Sample Co. had a positive year in 2001 due to a sizeable increase in its SBA 8(a) revenues. Sales increased by more than 60 percent and profits experienced related growth. The company is leveraged a little higher than the industry averages, but remains consistent with its historical trends. The slower turnover of accounts receivable has led to less than favorable working capital ratios, but this may be due to the growth experienced in the year 2001.
Overall the company appears to be in good financial health. However, a loss of any significant SBA 8(a) revenues could quickly lead to the deterioration of the Sample Co.’s financial picture due to the Company’s strong dependence on this revenue source.
Conclusion
The financial analysis skills applicable to solvency analysis and valuation engagements are critical to a thorough understanding of the entity being examined. With respect to valuation, this analytical effort is a significant component of both understanding the business and in evaluating specific company risk. Presenting this information in a graphical form helps both your client and the trier of fact understand, and hopefully concur with, the conclusion you have developed.
Gregory A. Gadawski, CPA, CVA and Darrell D. Dorrell, CPA, MBA, ASA, CVA, DABFA, CMA, CMC are principals of financialforensics® in Lake Oswego, OR, a highly specialized forensic accounting firm. Greg has specialized in forensic accounting, litigation, and valuation during the last four years. Darrell has practiced exclusively in the litigation and valuation related expert witness arena since 1977 and is a nationally recognized author and speaker on forensic accounting, litigation, valuation, and related matters. They can be reached via phone at 503-636-7999, E-mail at gregg@financialforensics.com, darrelld@financialforensics.com. Visit their web site at www.financialforensics.com.
This article was originally published in the December 2003 edition of National Litigation Consultants’ Review.


