
A Tale of Two Betas
The Definition of Risk is Standard Deviation of Returns; Here’s What it Means, and What it Has to Do with “Total Beta”
Is the Capital Asset Pricing Model (CAPM) superior as a valuation modeling tool to Total Beta? Peter J. Butler and Gary Schurman think not. Here’s why:
Total Beta, and its resultant calculation of the total cost of equity, have received much scrutiny in the valuation profession since Total Beta’s introduction. Critics in the business valuation profession believe that the proponents of Total Beta misrepresent and mischaracterize modern portfolio theory, and contend that capital asset pricing model (CAPM) Beta is superior.
Applying modern portfolio theory, this article concludes that Total Beta stands head and shoulders above the CAPM Beta and the Build-up Method.
Risk and Diversification
The definition of risk in finance is the standard deviation of returns. The ability to diversify involves placing individual risky assets that are not perfectly correlated into a portfolio. If enough assets are placed into the portfolio, firm-specific risk is diversified away. In other words, all firm-specific risk is removed from the volatility, or standard deviation, of portfolio returns. According to traditional financial theory, since public investors have the ability to diversify away this firm-specific risk, it is not priced. Investors are, therefore, left with only systematic risk to worry about. As financial professionals, we all know, at least according to traditional financial theory, that systematic risk is captured by CAPM Beta. (This article will not discuss the criticisms related to CAPM Beta or the newer theories which claim to capture additional systematic risks). What happens, though, if the investor cannot diversify away firm-specific risk?
The market for publicly traded stocks is dominated by institutional investors. Because fund size is large, and both information and trading costs are low, institutional investors are in a position to diversify their holdings such that returns are maximized relative to the fund’s risk parameters. Diversification is further enhanced by the fact that the institutional investor is a financial buyer and does not seek control, so relatively small stakes in many public companies are not only possible but sought after. The institutional investor, who competes with other institutional investors for assets, bids up asset prices to the point where the investor is only compensated for systematic risk because firm-specific risks are diversified away by all parties involved in the equilibrium pricing process.
Well diversified, institutional investors are the marginal investors (as opposed to individual investors trading relatively small lots of stock) in many publicly traded stocks. In this case, marginal means that they set the price of the stock. The market for privately traded stocks, on the other hand, is dominated by the entrepreneur. The entrepreneur seeks control, and more often than not has limited resources such that true diversification is impossible. The institutional investor does not participate in this market due to high information and trading costs, which make a relatively small investment (from the institutional investor’s perspective) impractical. Individual investors (not to be confused with entrepreneurs) do not participate in the private market, because they do not have the wherewithal to analyze the investment in the absence of both public information and a market-determined equilibrium price. Given the absence of institutional investors, as well as individual investors, entrepreneurs are the marginal investors who set the prices for most private companies. Given the market frictions described above (information and trading costs and lack of resources), entrepreneurs are compensated for more than just systematic risk.
Firm-specific risk is not completely diversified away by all parties involved in the equilibrium pricing process. In the case of the market for private stocks, investors demand, and receive, compensation for total risk (practically speaking) or at least something greater than systematic risk (theoretically speaking). Of course, depending on the level of diversification, company-specific risk will be priced in varying fashion. For example, a sole proprietor who has all of his net worth tied up in his company will price company-specific risk completely, whereas a private equity fund, which is better able to diversify, may price companies almost as if they were publicly traded and therefore use something akin to the CAPM Beta.
The market structure described above results in an undiversified investor or at least not an optimally diversified investor; the business owner/entrepreneur or private equity fund does not hold a well diversified portfolio or an optimally diversified portfolio. CAPM Beta, therefore, does not capture all of the risk that is priced in the private markets. Therefore, CAPM Beta must be “improved” or enhanced to ensure appraisers are capturing all of the systematic, as well as the un-diversifiable firm-specific risk, being priced in the private markets. This article will show the modern portfolio theory behind a private company’s Beta, as well as the practical applications of this improvement.
Deriving Private Company Beta
As a reminder, CAPM beta is defined as:
β = cov(s,m)/σ2m, [Equation 1]
which can be rewritten through mathematical substitution as:
β = (σs/σm ) ρsm [Equation 2]
where cov(s,m) is the covariance of the stock with the market portfolio, σ2m is the variance of the market portfolio, σs is the standard deviation of the public stock, σm is the standard deviation of the market portfolio, and ρsm is the correlation coefficient between the stock and the market portfolio.
To derive an appropriate private company Beta, we will define a business owner’s (or an interested buyer’s) portfolio as a portfolio of only two assets: the stock of his or her private company and the market portfolio (as a simplification, we will use the S&P 500 Index). Let’s then assume that the percentage of net worth allocated to the private company is captured by ω. Therefore, the percentage allocated to the market portfolio equals (1 – ω) in our two-asset portfolio.
By definition, the market portfolio has zero firm-specific risk. Therefore, all benefits from combining these two assets—the private company and the market portfolio—reduces the private company’s stand-alone Beta, which is known in the business valuation profession as Total Beta. As the name implies, Total Beta captures total risk—all systematic as well as firm-specific risk—because it relies entirely on relative standard deviation, instead of correlated relative standard deviation (see Equation 2), as shown in Equation 3 below:
Total Beta = σs/σm [Equation 3]
The correlation coefficient in Equation 2 can be viewed as the percent of total risk that is being priced by the public market. Viewed in this context, one minus the correlation coefficient is the percent of total risk that is removed by diversification.
Notice the only adjustment we made to convert CAPM Beta to Total Beta was to set the correlation coefficient equal to one in Equation 2, leaving a metric which captures the relative standard deviation between the stock and the market portfolio. In other words, if we add a stock to a portfolio which has perfect correlation with the portfolio, we have not gained any diversification benefit. So Total Beta is the appropriate Beta to use for private company valuation; if the private company is the only asset in a portfolio, then there is also no benefit from diversification. (The Practical Application section below will look to see if Total Beta warrants more frequent use than only in “stand-alone” situations.)
However, given these assumptions, we have two assets in our hypothetical portfolio. The private business, in most cases, will comprise the majority of the portfolio and will definitely not be perfectly correlated with the other asset (the market portfolio). In this two-asset portfolio some, but not nearly all, firm-specific risk is diversified away. Therefore, total risk will not be priced for the private company. Rather, some private-company Beta—a Beta greater than a CAPM Beta proxy and less than a Total Beta proxy—will be the appropriate risk metric to develop a cost of capital for a private company. We call them proxies because, of course, we cannot directly observe any Beta for a private company.
As financial professionals, we also all remember the equation for portfolio return variance, σ p 2, for a two-asset portfolio as:
σp2 = ω2 σs2 + (1 – ω) 2 σm2 + 2ω(1 – ω)σs σm ρsm [Equation 4]
The variance of this portfolio depends on all systematic risk, as well as the firm specific risk not diversified away. Even though, in our assumption, the business owner already owned the market portfolio, by adding a private company to the mix and investing a large percentage of his or her net worth in that company, he or she has “upset the apple cart” and is no longer well diversified.
How much of an asset’s total risk is not eliminated through this sub-optimal diversification and, therefore, priced in this scenario? Let’s find out below.
The risk-averse investor will not invest in a risky asset unless he or she expects to receive a return greater than the return from the riskless asset. The market price of risk is the additional return over the risk-free rate that risk-averse investors require per unit of volatility or unit of risk. Therefore, the market price of risk is measured as the expected return on the market portfolio, rm , in excess of the risk-free rate, r f , divided by the standard deviation of returns of the market portfolio:
Ф = (rm – rf )/σm [Equation 5]
We will define the variable, λ, as the percent of the private company’s Total Beta that is not eliminated through diversification for a two-asset portfolio. The product of Total Beta and λ, or (σs/σm )λ, is the private-company Beta that appraisers should use when valuing closely held companies. (We will look at the practical application of this theoretical observation below.)
Using the market price of risk shown above, the annual rate of return required by a risk-averse investor, r s, is:
rs = rf + σs λФ [Equation 6]
While this equation may not look familiar, it is no different in concept from the CAPM equation given as:
rs = rf + β(rm – rf )
rs = rf + (σs/ σm )ρsm (rm – rf ) [Equation 7]
where we assume investors are well diversified and therefore interested in Beta, (σs/σm )ρsm , only as a measure of risk, since all firm-specific volatility has been eliminated. In Equation 6 above, we take it as a given that all firm-specific risk is not completely eliminated when a private company is thrown into the mix. Business owners frequently place “all of their eggs in one basket” (or at least most of their eggs) and, therefore, experience suboptimal diversification.
We also know that the expected return in an investor’s portfolio, r p, is the weighted average of the portfolio’s individual asset expected returns. For our two asset portfolio:
rp = ωrs + (1- ω)rm [Equation 8]
Substituting Equation 6 appropriately for rs and knowing that rm is represented by:
rm = rf + σm Ф; [Equation 9]
where as proof:
Ф = (rm – rf)/ σm
(see Equation 5 above) and substituting this for Ф, results in rm = rm in Equation 8, we get
rp =ω(rf + σs λФ) + (1 – ω) ( rf + σm Ф)
rp = rf + ωσs λФ + (1 – ω)σm Ф [Equation 10]
Since we want to price all risk (systematic and un-diversifiable firm-specific) in our two-asset portfolio, the equation for portfolio expected return as a function of the market price of risk is:
rp =rf + σp Ф [Equation 11]
which is the same concept as the theory behind Equation 9 above. We can now set Equations 10 and 11 equal to each other and solve for the only unknown, λ.
rf + ωσs λФ + (1-ω) σm Ф = rf + σp Ф
ωσsλФ + (1- ω)σmФ = σpФ
ωσsλ + (1- ω)σm = σp
λ = (σp – (1- ω)σm)/ωσs [Equation 12]
As a reminder, this is the amount of total risk that is not eliminated through diversification in the two-asset portfolio. Private business owners seek a risk premium over and beyond just systematic risk times the market price of risk. They may seek a risk premium equal to total risk (if the private business is considered the only asset in their portfolio) times the market price of risk. If they are partially diversified, then they will theoretically seek a risk premium less than the total risk premium, which λ helps capture.
Looking to Equation 6 above for guidance:
rs = rf + σs λФ
rs = rf + σs λ(rm -rf )/σmwv
rs = rf + λ (σs /σm )(rm -rf ) [Equation 13]
Where private-company
Beta = λ(σs /σm ) [Equation 14]
Compare this with Total Beta in Equation (3) above. As one can see, unless λ is 1.0 (a one-asset portfolio), then the private-company Beta will be less than Total Beta, but something greater than CAPM Beta, ρsm (σs /σm ).
In summary, λ will always be greater than the correlation coefficient, ρsm , until we reach perfect diversification and hold the market portfolio. In an assumed two-asset portfolio, the diversification benefit will only approach ρsm as the relative weighting essentially approaches a single-asset portfolio (i.e., 1% private company weight, 99% market portfolio weight). Although one has to wonder if a hypothetical business owner ever reaches this relative weighting, what would be the point of owning a private business?
Substituting Equation (12) into (14) leads to:
Private-company Beta = ((σp – (1- ω)σm )/ωσs )(σs /σm )
Private-company Beta = (σp – (1- ω)σm )/ωσm [Equation 15]
Practical Applications
Let’s look at the practical side of this technique. As mentioned, appraisers look to the public markets for CAPM Betas (and now Total Betas). We will do the same to create Table 1.
Please keep in mind, these calculations are circular in nature. What we mean by that is we have to estimate the relative weighting of the two assets in the portfolio. However, before we know the relative weightings we have to value the private company, which depends on the private-company Beta.
As one can see in Table 1, all else being equal, the more weight assigned to a private company, the higher the λ. This makes intuitive sense as the higher the weight, the closer the portfolio gets to a one-asset portfolio where Total Beta (λ=1.0) would be the appropriate metric to capture all risk.
Table 1: Changing Total Beta and Resulting Correlation Coeffecient
(Assumes standard deviation of market portfolio = 20%)
|
|
Proxy |
|
|
|
Rounded |
|
|
% Wealth in Business |
CAPM Beta |
Total Beta |
Correlation Coefficient |
Private Co. Beta |
Lambda |
Standard deviation of Portiofio |
|
100% |
1.00 |
2.00 |
0.50 |
2.00 |
100.0% |
40.0% |
|
90% |
1.00 |
2.00 |
0.50 |
1.95 |
97.4% |
37.0% |
|
80% |
1.00 |
2.00 |
0.50 |
1.89 |
94.5% |
34.4% |
|
70% |
1.00 |
2.00 |
0.50 |
1.82 |
91.0% |
31.4% |
|
60% |
1.00 |
2.00 |
0.50 |
1.74 |
87.0% |
28.8% |
|
50% |
1.00 |
2.00 |
0.50 |
1.65 |
82.5% |
26.5% |
|
40% |
1.00 |
2.00 |
0.50 |
1.54 |
77% |
24.3% |
|
30% |
1.00 |
2.00 |
0.50 |
1.42 |
71.0% |
22.5% |
|
20% |
1.00 |
2.00 |
0.50 |
1.29 |
64.5% |
21.1% |
|
10% |
1.00 |
2.00 |
0.50 |
1.15 |
57.5% |
20.3% |
|
1% |
1.00 |
2.00 |
0.50 |
1.01 |
50.5% |
20.0% |
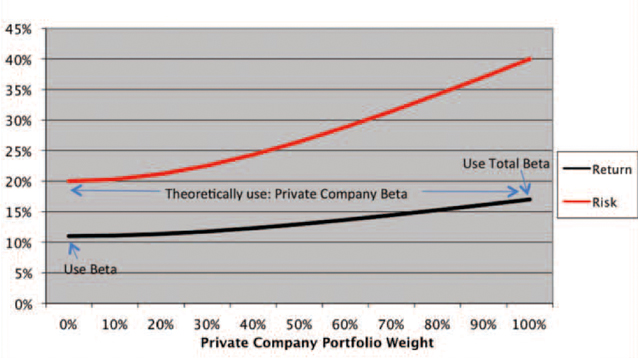
Graph 1: Portfolio Risk (Standard Deviation) And Portfolio Return
It appears that, practically speaking, the private company dominates the risk of the two-asset portfolio. We ran calculations for a few other scenarios, altering the CAPM Beta, Total Beta and correlation coefficient, and generally found the following results:
- At an equal 50-50% weighting given our assumptions, more than 80% of the total risk of the private company is still priced.
- At a 70% private company and 30% market portfolio weighting, more than 90% of total risk is still priced.
- At an 80% private company and 20% market portfolio weighting, approximately 95% of total risk is priced.
- At a 90% and 10% weighting, approximately 98% of total risk is still priced.
These large weightings, biased toward the private company, are realistic for many business owners/entrepreneurs.
We also show in Graph 1 how portfolio return and risk would look under different private company weightings, depending on the following assumptions (derived from Table 1):
- Risk-free rate = 5%
- Market price of risk = 0.3
- Market portfolio volatility = 20%
- Private company volatility = 40%
- Private-company Beta = 1.0 (like the market’s Beta)
- Correlation coefficient between the private company and the market portfolio = 0.5
In summary, as you increase the weight of the private company in the portfolio, the risk and return both increase due to sub-optimal diversification.
These results confirm that Total Beta, a risk metric that captures total risk, is by far the most useful Beta for appraisers in valuing privately held companies most of the time.
Given the inherent subjectivity in estimating weightings, the circular nature of the calculation, and the apparent lack of sensitivity to realistic weightings (90-10% , 80-20% , 70-30% , etc.), it may make sense to just calculate a proxy Total Beta for a privately held company. Practically speaking, estimating the relative diversification of the expected pool of buyers is a rather subjective, and not terribly sensitive, exercise.
For what it’s worth, we also believe that most, if not all, valuators and business brokers value/price privately held companies as stand-alone assets. It appears that this assumption has not been an “incorrect” decision, at least from a practical perspective. Having said that, we do recognize that Total Beta is not appropriate in all situations, such as when a private company is going public; when a public company is buying a private company; or when the likely pool of investors/purchasers can be considered diversified on some level, such as possibly a private equity fund that is investing across a wide variety of industries. As a reminder, there are two assumptions that underlie the use of Total Beta:
- The investor is not diversified or is sub-optimally so.
- The investor can fully price for the risk associated with this lack of diversification.
Appraisers who add company specific risk premiums accept these two assumptions by default because:
- Why would the appraiser add a company-specific risk premium if the investor can indeed diversify away company-specific risk?
- Why would the appraiser add a company-specific risk premium if the investor cannot fully price for this additional risk?
Appraisers who do not accept these two assumptions as fact cannot add company-specific risk premiums regardless of how these risk premiums are calculated (Total Beta, build-up method, etc.).
Moreover, since Total Beta captures total risk in an empirical manner, appraisers are no longer required to make educated guesses, with no empirical data to use as a proxy, regarding an appropriate firm-specific risk premium. This is its major contribution to the business valuation profession. When Total Beta (private-company Beta) is employed, it empirically captures all systematic and firm-specific risk that is practically (theoretically) priced. Hence, Total Beta lives up to its name and captures all pertinent risks that appraisers must price.
This article was originally published in the January/February 2011 issue of The Value Examiner.
Peter J. Butler, MBA, CFA, ASA, is the founder and principal of Valtrend, LLC, in Eagle, ID, which provides business valuation, litigation support, and financial advisory services (www.valtrend. com). He is inventor and co-developer of the Butler Pinkerton Calculator.
Gary Schurman, CPA/ ABV, MBE, CFA has over 25 years of experience in finance, accounting, and software development. He is currently a principal in Applied Business Economics (www. appliedbusinesseconomics.com). His practice areas include business valuation (equity, debt, preferred stock, options, etc.), business consulting, capital markets advisory, structured finance advisory, financial model building, and software consulting. He is the author of “Valuing Loan Guarantees,” in the November/December VE 2010 issue of The Value Examiner.


