
The Size Effect Continues to be Relevant
When Estimating the Cost of Capital (Part I of III)
In this paper, published in three parts with NACVA’s QuickRead, Roger Grabowski reviews the size effect, potential reasons why one observes the size effect, and correct common misconceptions and address criticisms of the Size Premia (SP). Throughout this paper, the author shows that using a pure market factor as the sole risk factor in estimating the expected return provide an incomplete estimate. For the last four decades, research has shown that adjustments to the CAPM are required. Here, Roger Grabowski addresses some of the criticism to the theoretical basis of the SP and to the application adopted through the CRSP Decile Size Premia and Risk Premium Report—Size Study. In part 2, Roger Grabowski demonstrates that the size premium critique by Clifford Ang is not warranted and that the alternative methodology proposed by that author is misleading and cannot be considered as an alternative to the Duff & Phelps’ SP. He also addresses other criticisms of the Duff & Phelps SP. Finally, in part 3 Roger Grabowski provides some practical guidance on efficiently and correctly applying SP.

Introduction
Valuation professionals frequently incorporate Size Premia (SP) in developing the cost of equity capital using the modified capital asset pricing model (MCAPM) to estimate an appropriate cost of capital for smaller firms.[1] Shannon Pratt and this author have previously addressed many of the issues surrounding the size effect in the Cost of Capital: Applications and Examples, fifth edition.[2] and we will be writing more extensively on the topic in the next edition. This author recently wrote a paper on SP to correct some misconceptions about SP and to show that—contrary to claims made by critics—data covering recent periods supports continued use of SP.[3]
The debate that has been raging in the academic sphere about the nature of this adjustment relates to its fundamental nature. Is it a risk factor that investors should be compensated for? Or is it related to firm characteristics? The jury is still out on this debate, but the need for an adjustment for the cost of capital relative to size is something that professionals need to consider given the limitations of CAPM and the market portfolio in explaining equity returns.
Size Effect—Brief History
The size effect is based on numerous empirical studies that show that companies of smaller size are associated with greater risk and, therefore, have a greater cost of capital. In other words, an observable (negative) relationship occurs between size and realized equity returns—as size decreases, returns tend to increase, and vice versa.
Traditionally, researchers have used market value of equity (market capitalization, or simply “market cap”) as a measure of size in conducting historical rate of return studies. However, market cap is not the only measure of size that can be used to predict returns, nor it is necessarily the best measure of size. In fact, the use of market cap as a measure of size is the cause of much of the confusion about the size effect.
One of the first characteristics that researchers analyzed was the difference between market adjusted returns of large- versus small-market-capitalization companies. Market capitalization data are readily available in the Center for Research in Security Prices (CRSP) database. Banz (1981) examined the returns of New York Stock Exchange (NYSE) small-cap companies compared to the returns of NYSE large-cap companies over the period 1926 to 1975 and observed that the returns of small-cap companies were greater than the returns for large-cap companies.[4]
Roger Ibbotson and Rex Sinquefeld began publishing summaries of data that demonstrated the size effect (later incorporated in the annual Stocks, Bonds, Bills and Inflation [SBBI®]) based on analyzing the CRSP data with market cap as the measure of size.[5] In a recent paper, Roger Ibbotson and James Harrington explained that the SP should be measured by removing the portion of observed excess return that is attributable to the market factor, leaving only the size effect’s contribution to excess return.[6]
This author still reads references to “small stock premium” when the writer is referring to SP and vice versa. To avoid confusion, it is important to accurately define the relationship one is discussing.
While many critiques of the size effect focus on the small stock premium with size measured by market capitalization, we shall examine the beta-adjusted size premia now published as the CRSP Decile Size Premia.[7]
First, why do we observe the empirical CRSP Decile Size Premia? For example, is the size effect simply the result beta estimation error? That is, if we had a better way of estimating beta the CAPM would we not observe the SP? Or, are there simply market anomalies that cause the size effect to appear? Is size a proxy for one or more other factors correlated with size? If so, should one directly use these factors rather than size to measure risk? Is the size effect hidden because of unexpected events?
Possible Explanations for the Size Effect
SP are based on empirical observations. The observed returns of small-cap stocks adjusted for beta risk in excess of returns of large-cap stocks calls into question whether the textbook CAPM fully explains stock returns. If CAPM were fully explaining the returns on stocks, then why do we find a size effect after adjusting for beta? This question has spawned a large body of research.
Small companies are believed to have greater required rates of return than do large companies because small companies are inherently riskier. It is not clear, however, whether this is attributable to size itself, or to other factors closely related to or correlated with size. Banz’s insight in his 1981 article remains as pertinent today as it was thirty-seven years ago:
It is not known whether size [as measured by market capitalization] per se is responsible for the effect or whether size is just a proxy for one or more true unknown factors correlated with size.[8]
Practitioners know that small firms measured in terms of fundamental size measures such as assets or net income have risk characteristics that differ from those of large firms. For example, potential competitors can more easily enter the “real” market (the market for the goods and/or services offered to customers) of the small firm and take the value that the small firm has built. Large companies have more resources to better adjust to competition and avoid distress in economic slowdowns. Small firms undertake less research and development and spend less on advertising than large firms do, giving them less control over product demand and potential competition. Small firms have fewer resources to fend off competition and redirect themselves after changes in the market occur.[9]
Smaller firms often have fewer analysts following them, and less information available about them. Smaller firms may have less access to capital, thinner management depth, a greater dependency on a few large customers, and their stocks may be less liquid than the stocks of their larger counterparts. One study found that analysts and investors have difficulty evaluating small, little-known companies and estimating traditional quantitative risk measures for them. This ambiguity adds to the risk of investment and increases the return required to attract investors.[10]
The characteristics of smaller firms generally cause the rate of return that investors expect when investing in stocks of small companies to be greater than the rate of return expected when investing in stocks of large companies.
Several authors have investigated problems with estimating beta, a forward-looking concept, using historical returns over look-back periods. The most common method used in estimating beta is the ordinary least squares (OLS) regression of historical returns over a look-back period. If the true beta is underestimated, SP will be observed and the cost of equity capital estimated using the textbook CAPM will be underestimated.[11] SP can be seen as a correction for this underestimation.
For example, in several papers the authors investigated the problem with underestimated betas for “troubled” firms that tend to populate the smaller deciles when size is measured by the market value of equity.[12] As the market value of equity gets bid down for a troubled company, its stock may trade like a call option.
This suggests, for example, that SP may be overestimated in CRSP subdecile 10z which is populated with the smallest companies as measured by market cap. The CRSP Decile Size Premia include all companies with no exclusion of speculative (e.g., start-up) or distressed companies whose market cap is small because of being speculative or distressed. Some critics have held that the inclusion of speculative or distressed companies in the database is a basis for criticism of the size effect.[13] We will return to a discussion of subdecile 10z later.
Size Effect—More Research
In 1990, this author, who regularly applied SP when estimating the cost of equity capital using the MCAPM, was confronted with criticisms of the size effect and began closely studying the relationship between company size and stock returns. This research focused on whether stock returns were predicted by measures of size other than market cap, and whether stock returns were predicted by fundamental risk measures based on accounting data. We found that as size decreases, or risk increases (as measured by fundamental accounting data), returns tend to increase (and vice versa). Thereafter, we published a series of articles reporting our findings, culminating with a seminal 1996 article and a subsequent article in 1999 that together serve as the foundation of the Risk Premium Report studies.[14]
These studies differ from some of the academic research in the way the portfolios are constructed. The basic methodology is akin to that used by valuation professionals when identifying guideline public companies when valuing a non-publicly traded business. Valuation professionals begin their investigation by searching for appropriate guideline public companies to include in their estimation of beta and their Market Approach analysis, by examining the characteristics of potential guideline public companies and comparing those characteristics to those of the subject business.
The valuation professional strives to identify the hypothetical “as if publicly traded” market value of the subject company by comparing its metrics to those of publicly traded companies with comparable risk proxies and expected return characteristics as the subject company. For example, if the subject company is an established small company, the most appropriate guideline companies are those established publicly traded companies that are in the same industry but are also small. Likewise, if the subject company is not highly levered and is profitable, the most appropriate guideline pubic companies in its industry are those that are not highly levered and are profitable. It is easy to understand in applying the Market Approach (i.e., applying multiples derived from guideline public companies to the subject company). Even then, some researchers erroneously claim that valuation professionals should apply an average multiple drawn from all companies in an industry whether they would be considered guideline companies or not. This faulty line of reasoning was countered in recent empirical research.[15]
The same logic follows in examining the returns of similar public companies to develop a discount rate appropriate for the subject company. That is, the historic returns of companies with comparable characteristics as those of the subject company should be used as evidence of the likely expected returns for the subject company. That logic guided us in constructing the portfolios reported in the Risk Premium Report studies.
The Risk Premium Report studies screen out speculative start-ups, distressed (i.e., bankrupt) companies, and other high financial risk companies. We are examining the returns of relatively financially healthy, high-quality firms.[16] This methodology was chosen to counter the criticism of the size effect by some that the SP is a function of the high rates of return for speculative companies and distressed companies in the data set.
Financial services companies are also excluded from the analysis because the regulated nature of banks and insurance companies causes their underlying characteristics to differ from those of non-regulated companies.[17]
Risk Premium Report—Size Studies[18]
The Risk Premium Report—Size Studies report on size premia where size is measured in eight different measures: market capitalization (market value of equity); book value of equity; five-year average net income (measured for five preceding years); market value of invested capital (MVIC); total assets; five-year average EBITDA (measured for five preceding years); sales; number of employees.
We have several reasons for using alternative measures of size (in addition to the market cap used in the CRSP Decile Size Study).
First, financial literature indicates that a bias may be introduced when ranking companies by market value, because a company’s market capitalization may be affected by characteristics of the company other than size. In other words, some companies might be small (as measured by market cap) because they are risky (high discount rate), rather than risky because they are small (small assets or small income).[19]
One simple example could be a company with a large asset base, but a small market capitalization as a result of high leverage or depressed earnings. Another example could be a company with large sales or operating income, but a small market capitalization attributable to being highly leveraged.
Second, market cap may be an imperfect measure of the risk of a company’s operations.
Third, using alternative measures of size may have the practical benefit when estimating the cost of capital for a non-public business. The analyst then does not need to first make a guesstimate of size (i.e., the hypothetical market cap of the subject company) in order to know which portfolio’s premium to use (this issue is commonly referred to as the “circularity” issue). While market cap for the non-publicly traded company is not available, other size measures, such as assets, net income or sales, are generally available.
The size portfolios returns are calculated as an equally weighted average return of all companies in the size ranked portfolio. The valuation professional is not building investment portfolios but rather, we are determining the return of a typical company with a certain size characteristic over time.[20] By design all the companies within our ranked portfolio have a similar size.
For illustrative purposes, we focus on the results of the Size Study for four measures of size based on returns for 1981 through 2016 and 1990 through 2016[21] for the portfolios comprised of the smallest companies (as measured by the respective size measure) (Portfolios 21 through 25) (see Exhibits 1, 2, 3, and 4). The size premia (observed premium over CAPM) is observed for both periods, 1981–2016 and 1990–2016 (see “Premium over CAPM” columns).
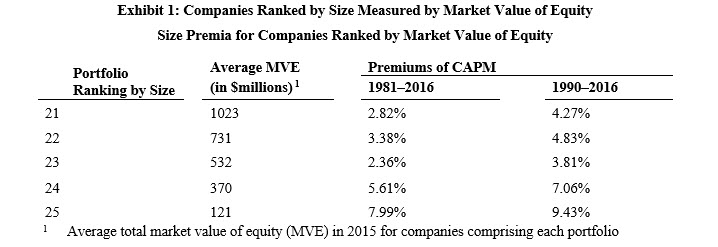
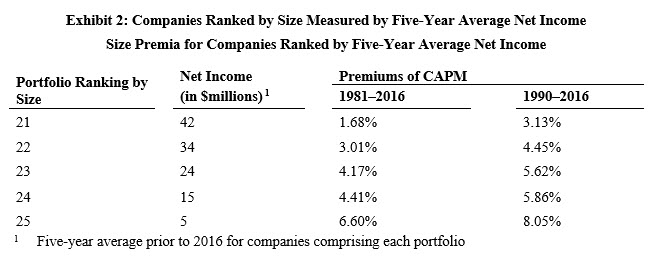
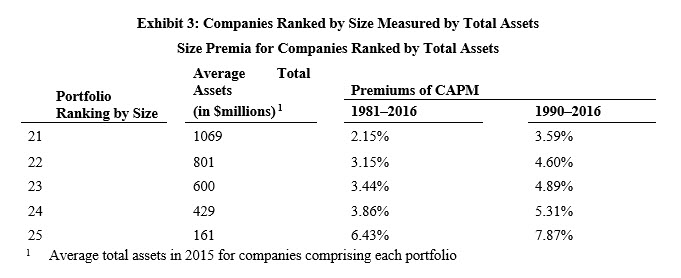
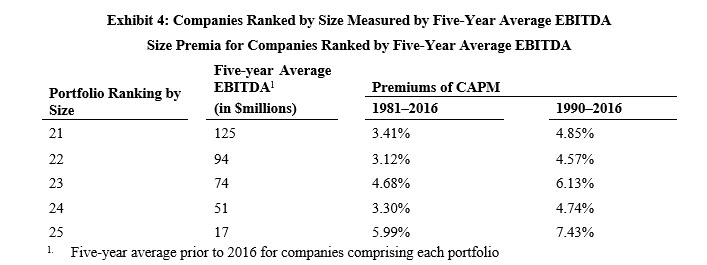
The choice of these specific periods is meant to counter the criticism that SP have disappeared in the post-Banz periods.[22] The pattern of SP persists between the period 1981–2016 and 1990–2016.We are not advancing that these changes should be uniformly monotonic as we are presenting empirical results. We make no claim that there is an underlying theory. Rather, SP are a correction to a theory shown to be fraught with problems.
In summary, given this recent evidence, one can conclude that the size effect can still be used today by valuation professionals.
Is the Size Premium a Proxy for Other Characteristics?
Size and fundamental risk of small companies are related. Exhibits 5, 6, 7, and 8 display select data for the same periods as shown in Exhibits 1 to 4 above. We display the data for the portfolios comprising the largest firms as measured by the respective measure of size, Portfolios 1, 2, and 3, and the data for the portfolios comprised of the smallest firms as measured by the respective measure of size, Portfolios 21 through 25.
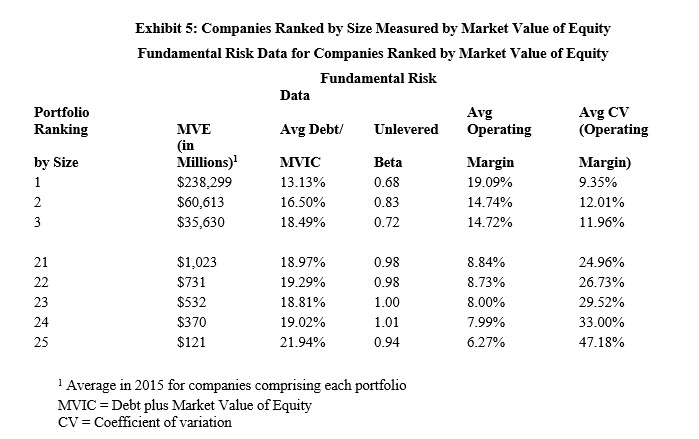
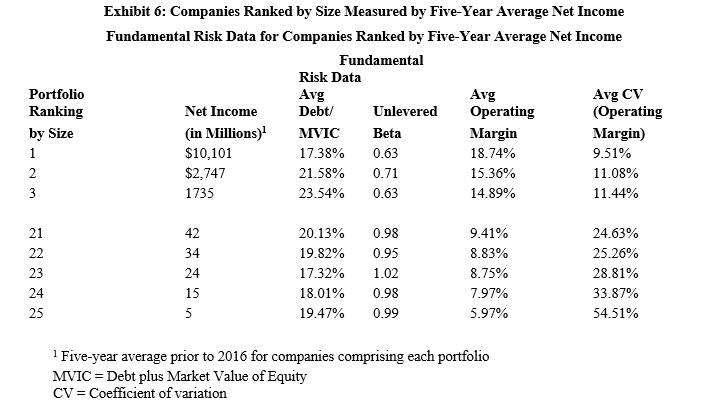
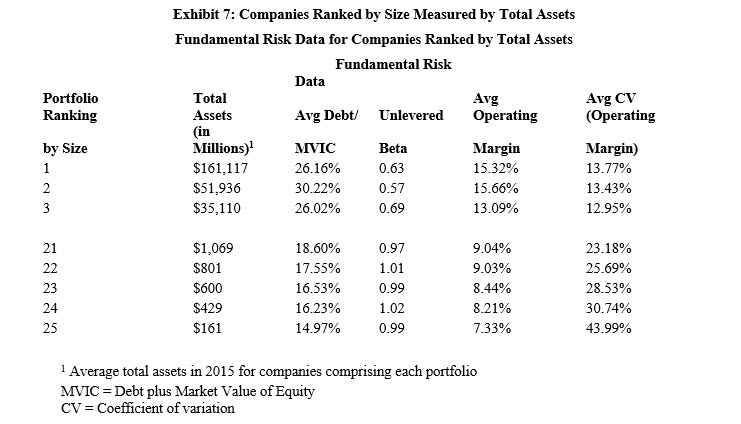
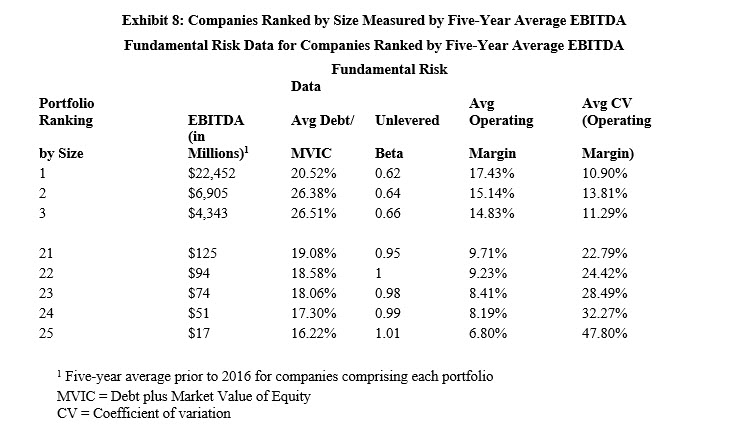
We make the following observations:
- The increase in SP as size decreases is not the result of significantly different amounts of debt among the companies comprising the portfolios (see “Avg Debt to MVIC” columns), recall that the high financial risk companies have been excluded in the basic Risk Premium Report analysis.
- Business risk as measured by the unlevered asset beta (i.e., greater asset beta indicates greater business risk) generally increases as size decreases (see “Average Unlevered Beta” column).
- Business risk as measured by the average operating margin (i.e., a lower average operating margin indicates greater business risk) generally increases as size decreases (see “Average Operating Margin” column).
- Business risk as measured by the variability of operating margin over the prior five years (i.e., a higher coefficient of variation of operating margin indicates greater risk) generally increases as size decreases (see “Average CV [Operating Margin]” column).[23]
Liquidity affects the cost of capital.[24] For this purpose, liquidity refers to the speed at which a large quantity of a security can be traded with a minimal impact on the price and with the lowest transaction costs. Stocks of small companies generally do not have the same level of liquidity as large-company stocks. This is likely a function of the mix of shareholders and underlying risk characteristics. Many institutional investors do not own stocks in small companies because they have too much money to invest relative to the size of these companies or because small firms are not part of widely followed market indices that requires them to allocate in these firms for benchmarking. If they are to invest as little as one percent of their available funds in a small company, they likely would control the company. Institutional investors generally want enough liquidity to move in and out of their positions in a single firm without disrupting the market. Therefore, one does not see the breadth of investors investing in small-cap stocks, as one sees in large-cap stocks.
Furthermore, the level of information asymmetry is very high in small companies. Small companies generally are followed by a small number of analysts, if any at all. This makes it more difficult for investors to acquire information on and evaluate small firms, leading to a high level of uncertainty about its cost of capital.[25]
Are SP observed for smaller companies (after adjusting for differences in beta) the result of difference in size or differences in liquidity? Differences in liquidity certainly impact the observed returns in publicly traded stocks but if one is estimating the cost of capital for a small, nonpublic business, the analyst has no observations as to the liquidity that company’s stock might have were it public. We can only hypothesize that the liquidity of that stock would be similar of other publicly traded stocks of companies of similar size.
Fundamental risk may be contributing to the liquidity effect. That is, the greater underlying risks of small companies relative to those of larger companies may cause investors to shy away from small companies, reducing their liquidity. Thus, reduced liquidity may also be a coincident indicator of fundamental risk.
This article was previously published in the American Society of Appraisers’ Business Valuation Review, Vol 37(3) Fall 2018, and is re-published here with permission.
Roger J. Grabowski, FASA, is a managing director with Duff & Phelps and an Accredited Senior Appraiser and Fellow (FASA) of the American Society of Appraisers (ASA) (their highest designation).
He was formerly Managing Director of the Standard & Poor’s Corporate Value Consulting practice, a partner of PricewaterhouseCoopers LLP and one of its predecessor firms, Price Waterhouse (where he founded its U.S. Valuation Services practice and managed the real estate appraisal practice).
He has directed valuations of businesses, interests in businesses, intellectual property, intangible assets, real property and machinery and equipment. Mr. Grabowski has testified in court as an expert witness on matters of solvency, the value of closely held businesses and business interests, valuation and amortization of intangible assets and other valuation issues. His testimony in U.S. District Court was referenced in the U.S. Supreme Court opinion decided in his client’s favor in the landmark Newark Morning Ledger case.
Mr. Grabowski is co-author with Shannon Pratt of Cost of Capital: Applications and Examples, fifth edition. (John Wiley & Sons, 2014), The Lawyer’s Guide to Cost of Capital (ABA, 2014), and Cost of Capital in Litigation: Applications and Examples (John Wiley & Sons, 2010). He is a contributor to the Duff & Phelps on-line Cost of Capital Navigator platform and he is co-author of the Duff & Phelps annual books: Valuation Handbook-U.S. Industry Cost of Capital, Valuation Handbook—International Guide to Cost of Capital and Valuation Handbook—International Industry Cost of Capital.
Mr. Grabowski teaches courses for the American Society of Appraisers and is a frequent guest lecturer at NACVA Annual Conferences.
Mr. Grabowski can be contacted at (312) 697-4720 or by e-mail to Roger.Grabowski@duffandphelps.com.
[1] Shannon P. Pratt and Roger J. Grabowski, “Capital Asset Pricing Model,” Chap. 10 of Cost of Capital: Applications and Examples. Fifth edition. (Hoboken, New Jersey: John Wiley & Sons, Inc., 2014).
[2] Ibid, Chap. 15.
[3] Roger J. Grabowski, “The Size Effect—It is Still Relevant,” Business Valuation Review 35 (2) 2016: 62-71; data is presented from 1990 through 2014.
[4] Rolf W. Banz, “The Relationship between Return and Market Value of Common Stocks,” Journal of Financial Economics (March 1981): 3–18. This paper is often cited as the first comprehensive study of the size effect.
[5] Later the SBBI® Yearbook was replaced by the SBBI® Valuation Yearbook (which was published by Morningstar until 2013). The data series was more recently published in the Duff & Phelps Valuation Handbook—U.S. Guide to Cost of Capital from 2014 through 2016 and now available via the on-line Duff & Phelps Cost of Capital Navigator platform at dpcostofcapital.com.
[6] Roger G. Ibbotson and James P. Harrington, “Using a Non-Beta-Adjusted Size Premium in the Context of the CAPM Will Likely Overstate Risk and Understate Value,” https://quickreadbuzz.com//2019/01/30/business-valuation-ibbotson-harringtonusing-1-non-beta-adjusted-size-premium/, January 31, 2019.
[7] Published in 2014 through 2017 in the annual Duff & Phelps Valuation Handbook—U.S. Guide to Cost of Capital and now available via the on-line Duff & Phelps Cost of Capital Navigator platform at dpcostofcapital.com.
[8] Rolf W. Banz, “The Relationship between Return and Market Value of Common Stocks,” Journal of Financial Economics (March 1981): 3.
[9] See for example, M.S. Long and J. Zhang, “Growth Options, Unwritten Call Discounts and Valuing Small Firms,” EFA 2004 Maastricht Meetings Paper no. 4057, March 2004.
[10] R. Olsen and G. Troughton, “Are Risk Premium Anomalies Caused by Ambiguity?” Financial Analysts Journal (March–April 2000): 24–31.
[11] Sabine Elmiger, Sabine, “CAPM—anomalies: quantitative puzzles,” Article in Econ Theory (June 2018). http://doi.org/10.1007/s00199-018-1137-5
[12] Carlos A. Mello-e-Souza, “Bankruptcy Happens: A Study of the Mechanics of Distressed Driven CAPM Anomalies,” Working paper, January 25, 2002; and “Limited Liability, the CAPM and Speculative Grade Firms: A Monte Carlo Experiment,” Working paper, August 18, 2004.
[13] Jonathan B. Berk, “A Critique of Size Related Anomalies,” Review of Financial Studies 8(2) (Summer 1995): 225–286.
[14] Roger J. Grabowski and David King, “New Evidence on Size Effects and Equity Returns”, Business Valuation Review (September 1996): 103-115; Roger J. Grabowski and David King, “New Evidence on Equity Returns and Company Risk”, Business Valuation Review (September 1999, revised March 2000): 32–43.
[15] Friedrich Christian Rose Sommer and Arnt Wohrmann, “Negative Value Indicators in Relative Valuation—An Empirical Perspective,” Journal of Business Valuation and Economic Loss Analysis 2014 Vol 9 (1):23–54.
[16] This analysis can be thought of as consistent with the findings of Clifford S. Asness, Andrea Frazzini, Ronen Israel, Tobias J. Moskowitz and Lasse Heje Pedersen, “Size Matters, if you Control your Junk,” Journal of Financial Economics (2018): 479–509.
[17] Because financial services companies are excluded from the base set of companies used to develop the analyses presented in the Risk Premium Report studies, the data published should not be used to estimate cost of equity for financial services companies (i.e., companies with a SIC Code that begins with 6).
[18] See Chapter 7, “The CRSP Decile Size Premia Studies and the Risk Premium Report Studies—A Comparison,” Chapter 9, “Risk Premium Report Exhibits- General Information,” and Chapter 10, “Risk Premium Reports—Examples,” available through the online Cost of Capital Navigator platform at dpcostofcapital.com.
[19] Jonathan B. Berk, “A Critique of Size Related Anomalies,” Review of Financial Studies 8 (2) (Summer 1995):225–286.
[20] This is comparable to the construct of the S&P Equal Weighted Index.
[21] The exhibits presented herein are based on data extracted from the data used to prepare Risk Premium Report Exhibit B that appeared in the 2017 Valuation Handbook—Guide to Cost of Capital for the period 1963 to 2016. In developing cost of capital estimates, one should use data for the period ending prior to the valuation date.
[22] Clifford S. Asness, Andrea Frazzini, Ronen Israel, Tobias J. Moskowitz and Lasse Heje Pedersen, in “Size Matters, if you Control your Junk,” Journal of Financial Economics (2018): 479–509 similarly found that the size effect did not disappear in pos-Banz periods.
24 These data represent average observed relationships. In part 3, the author will provide some practical advice in considering incorporating SP in cost of capital estimates.
[24] See for example, Roger G. Ibbotson and Daniel Y.-J. Kim, “Risk and Return within the Stock Market: What Works Best?” working paper, January 8, 2016. Available at www.zebracapital.com/research.php
[25] Ravi Bhushan, “Firm characteristics and analyst following.” Journal of Accounting and Economics 11.2-3 (1989): 255–274.
Related posts
-

Understanding IPCPL Theory, Evidence, and Application
-

Why Do We Mess With the Cost of Equity
-

Business Valuations
-

Best Practices for Estimating the Company-Specific Risk Premium
-

Best Practices for Estimating the Company-Specific Risk Premium
-

StraightTalk Webinar Series
-

The Valuation Impact of Using the Wrong Leverage Ratio to Unlever Betas
