
In an economic environment where supply shocks and inflation are either not risks or pressing concerns, changes in net working capital receive limited attention. However, where supply shocks and or inflation are real risks, analysts must reassess traditional views to understand net working capital is fluctuating and what strategy management is espousing, along with the risks those strategies bring. In this article, the author invites readers to reassess their views on the implications of changes in net working capital.
To answer this question, a brief review is helpful.
Working capital (total current assets – total current liabilities) is an accounting metric that provides an indication of a company’s short-term financial health (its liquidity and ability to meet short-term obligations), its effective financial management, operational efficiency, and longer-term viability.
Net working capital (NWC) is an abbreviated version of working capital. Also, operating working capital or non-cash working capital, it is computed as follows:
Formula 1: (Total Current Assets – Cash and Cash Equivalents – Marketable Securities) – (Total Current Liabilities – Short-Term Interest-Bearing Debt – Current Portion of Long-Term Interest-Bearing Debt)
Simplified versions of this are:
Formula 2: (Accounts Receivable + Inventory + Prepaid Expenses) – (Accounts Payable + Accrued Expenses + Deferred Revenue)
Formula 2a: Operating Current Assets – Operating Current Liabilities
Cash, cash equivalents, and marketable securities are removed from total current assets because they earn a fair return, function more like investing activities, and are not directly involved in core operations. Thus, they are also termed “non-operating current assets”.
Two exceptions to this rule are: 1) companies that operate in poorly developed banking systems and 2) companies that must maintain high cash balances for day-to-day operations.[1] “To the degree that cash cannot be invested to earn market returns, and is needed for day-to-day operations, it is appropriate to look at changes in net working capital, with cash included.”[2]
Termed “non-operating current liabilities”, short-term interest-bearing debt (including the current portion of long-term interest-bearing debt) are removed from total current liabilities because debt is a source of financing rather than directly involved in core operations. In addition, these forms of debt are explicitly considered in computing the cost of capital and in developing forecasted net cash flows. Inclusion in working capital would count them twice.
In general, higher values for both working capital and NWC indicate more company stability and less liquidity risk. However, NWC is the metric of choice in valuation because it focuses explicitly on a company’s operational efficiency and its impact on free cash flows.
Negative net working capital occurs when operating current liabilities exceed operating current assets. It can be a sign of operating efficiency, i.e., receivables are being collected efficiently, inventory is turning over quickly, and/or more advantageous payables terms have been negotiated. However, it can also be a sign of increased liquidity risk caused by lack of sales, reduced purchase of inventory due to declining customer demand, or cash mismanagement.
A firm that has negative working capital is, in a sense, using supplier credit as a source of capital, especially if the working capital becomes larger as the firm becomes larger. Several firms, with Walmart and Dell being the most prominent examples, have used this strategy to grow. While this may seem like a cost-efficient strategy, there are potential downsides. The first is that supplier credit is generally not free. To the extent that delaying paying supplier bills may lead to the loss of cash discounts and other price breaks, firms are paying for the privilege. Thus, a firm that decides to adopt this strategy will have to compare the costs of this capital to more traditional forms of borrowing.
The second is that a negative non-cash working capital has generally been viewed both by accountants and ratings agencies as a source of default risk. To the extent that a firm’s rating drops and interest rates paid by the firm increase, there may be costs created for other capital by using supplier credit as a source.[3]
This is all familiar material. So, why should it now be accorded particular importance? After all, we have simple formulas for calculating NWC in our models of net cash flow. Are these not good enough?
One possible answer can be found in two quotes from the J.P. Morgan Working Capital Index Report for 2022 and 2024. These statements hold true in 2026 as well.
2022 has begun with a perfect storm of supply chain disruption, geopolitical tensions, and quantitative tightening in response to the 40-year high inflation, which is causing volatility in the overall economy. Companies need to closely review their end-to-end supply chains to be able to withstand the supply shock to build sustainability and resiliency, which is heightening the pressure on working capital. Efficient working capital can also unlock significant value and free up cash for investing in strategic areas …[4]
With a fast-evolving macroeconomic environment, higher interest rates, and supply chain uncertainties, business should focus on strong balance sheet management, while always maintaining access to liquidity. Companies should also continue to focus on working capital optimization opportunities.[5]
Another is that failure to understand the reasons behind historical changes in NWC (Δ NWC) may lead to misinterpretation of company risk or misadjustment of forecasted cash flows.
We know that Δ NWC exhibits a counterintuitive impact on cash flows. Increases in NWC (i.e., operating assets > operating liabilities) represent cash outflows because “cash tied up in working capital cannot be used elsewhere in the business and does not earn returns.”[6] Decreases in NWC (i.e., operating assets < operating liabilities) represents cash inflows because cash has been freed up from working capital for use elsewhere and for earning returns.
Thus, interpretation of historical Δ NWC requires careful examination of the subject company. An increase in NWC could be due to increased accounts receivable (A/R) or inventory balances. Increased A/R might mean that the company’s cash collection processes are inefficient or that some portion of A/R has become uncollectible (i.e., will never become cash). It could also mean that the company is going through a revenue growth spurt, enhanced through increased credit sales.
Increased inventory balances might mean that inventory is not being sold quickly enough or at all. Or it could mean that the company is stockpiling certain critical inventory items in advance of an upcoming shortage. It could also simply mean that, at the measurement period, cash has been spent on stock that has not sold yet but will sell.
In addition, historical Δ NWC can be volatile, exhibiting large swings between increases and decreases from year to year. Thus, it may not be a reliable benchmark for forecasting.
While there are techniques and methods available to address the forecasting challenge, they often raise additional questions about company risk. Dr. Damodaran discusses several, paraphrased below. They are all based on the potential correlation of Δ NWC with revenue growth.[7]
- Use the Δ NWC for the most recent year. Grow that change in NWC at the same rate as earnings are expected to grow in the future. This is probably the least desirable option because changes in non-cash working capital from year to year are extremely volatile and the most recent year’s change may in fact be an outlier.
- Base forecasted Δ NWC on non-cash working capital as a percent of revenues in the most recent year and expected revenue growth in future years. This is a much better option than the first one, but the non-cash working capital as a percent of revenues can also change from one year to the next and the most recent year may be an outlier.
- Base forecasted Δ NWC on the marginal non-cash working capital as a percent of revenues in the most recent year and expected revenue growth in future years. Marginal non-cash working capital is computed by dividing the Δ NWC in the most recent year into the change in revenues in the most recent year. This approach is best used for firms whose business is changing and where growth is occurring in areas different from the past.
- Base forecasted Δ NWC on non-cash working capital as a percent of revenues averaged over a historical period. The advantage of this approach is that it smooths out year-to-year shifts. However, it may not be appropriate if there is a discernable trend (upwards or downwards) in NWC over the period.
- Ignore the working capital history of the firm and base forecasted Δ NWC on the industry average non-cash working capital as a percent of revenues. This approach is most appropriate when historical NWC is volatile and unpredictable. It is also the best way of estimating non-cash working capital for very small firms that may see economies of scale as they grow.
The following table provides a summary of results of each technique, using data from a publicly traded retailer and a 10% growth rate in revenues over the forecast period. All dollar figures are in millions.[8]
Table 1: Example of Results from Revenue-Based Techniques
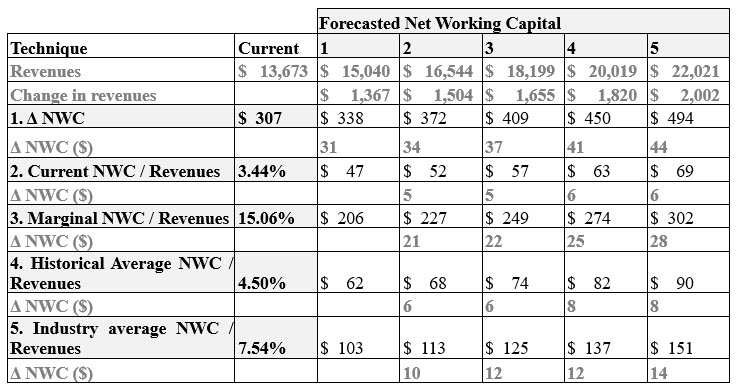
As demonstrated, depending on which technique is used, there can be wide variation in the calculated Δ NWC that is placed into a net cash flow model. Which is best to use? Can we defend our choice adequately considering actual company facts?
Additional Methods and Discussion
Under the scenario in which management chooses to deliberately decrease NWC over one or several forecast years to reduce operating inefficiencies, we would need to model NWC forecasts differently. Management’s proposed tactics for efficiency improvement would need to be incorporated into the NWC model. Since decreases in NWC indicate cash inflows, we will add forecasted NWC decreases to net income to derive net cash flows. In turn, value increases.
Another scenario might develop in which forecasted increases or decreases in NWC, correlated to revenues or based on management expectations, fall short of computed working capital requirements. This might require utilizing computed working capital requirements for the initial forecast year and applying growth rates for the following years based on discussions with management.
What if the Δ NWC for a single forecast year or two must reflect management expectations of unique operating circumstances? Is this already captured in forecasted net income? How should the remainder of the NWC forecast be developed?
The Critical Effect of Time on Forecast Choices
In addition, the period over which we utilize any of these techniques or methods becomes an important consideration.
For example, do techniques that increase NWC in sync with revenue growth but decrease value year over year reach a point where they no longer fairly represent the necessary role of Δ NWC in growth? Are there circumstances in which a subject has sufficient NWC built into net income and no longer requires it to grow? Should we extend any NWC increases into the perpetual terminal period? Why or why not?
At what point do we stop decreasing NWC for the sake of efficiency because it begins to increase risk and diminish value? Is the cash released via decreases in NWC actually available to distribute to investor/owners or does it need to remain in the company to address future operating liabilities? Should we ever extend NWC decreases into the perpetual terminal period? Why or why not?
The Need for Common Sense
The reasonableness test of common sense applies to the use, interpretation, and defense of NWC forecasting techniques and methods. For example, an industry-based technique that yields an annual increase in NWC of $3,000 for a growth company with $25MM in current revenues may indicate that we question either the technique selected and/or the forecast inputs.
Common sense often constrains the use of detailed models for subject companies whose size and/or historical performance only lend themselves to abbreviated financial analysis such as the capitalization of net cash flow (CCF) method. That said, working capital adjustments are made in a CCF. Thus, it may not be appropriate to apply a formulaic technique to NWC without having performed, at a minimum, a superficial inspection of the factors that are influencing NWC and Δ NWC for the subject.
Another Way to Look at Risk in our Models
As we develop net cash flow available to investors/owners, we consider changes in CapEx, the effects of taxation, and the existence of non-cash items (such as depreciation). We also consider the effects of interest-bearing debt. Owing to the substantial influence these can have on risk and value, we create and use detailed forecasting models for each.
If Δ NWC represents an inflow or outflow of operating cash, then why are we not performing NWC forecasts with as much detail and rigor as we apply to CapEx, interest-bearing debt, non-cash items, and taxation? This will require thorough understanding of the subject’s operating model, its business cycle, its cash conversion cycle, its working capital requirements, and the other factors that influence reasonable estimates of future NWC, i.e., critical factors affecting company risk.
Notwithstanding how we choose to model Δ NWC, adding more thought and rigor will produce more robust valuation analysis, enhanced understanding of company risk, and, in the end, better client service.
[1] Paraphrase of Damodaran, A. “Working Capital in Valuation” https://pages.stern.nyu.edu/~adamodar/New_Home_Page/valquestions/noncashwc.htm
[2] Damodaran, A. “Discussion Issues and Derivations”
https://pages.stern.nyu.edu/~adamodar/New_Home_Page/CFTheory/deriv/ch14der.html
[3] Damodaran, A. “Working Capital in Valuation” https://pages.stern.nyu.edu/~adamodar/New_Home_Page/valquestions/noncashwc.htm
[4] Shah, G., Fraser, J., Mandhana, V., Verma, V. Working Capital Index Report 2022. J.P. Morgan. p. 7.
[5] Kampton, T., Murphy, K., Mandhana, V., Verma, V. Working Capital Index Report 2024. J.P. Morgan. p. 28.
[6] Damodaran, A. “Discussion Issues and Derivations”
https://pages.stern.nyu.edu/~adamodar/New_Home_Page/CFTheory/deriv/ch14der.html
[7] Paraphrased from Damodaran, A. “Working Capital in Valuation” https://pages.stern.nyu.edu/~adamodar/New_Home_Page/valquestions/noncashwc.htm
[8] Ibid. Adapted.
Sarah Von Helfenstein, MBA, CVA, is a Forensic and Valuation Services Associate Director at Dean Dorton and is based in Raleigh, NC. For the past 30 years, she has specialized in financial valuation, served as valuation professional and educator in her own and public accounting firms, and for the AICPA and American Society of Appraisers. During this time, she also participated in several tech startups. In addition, Ms. von Helfenstein performed seminal research for the U.S. Department of Defense Office of Force Transformation in the valuation of information systems and human capital. Her experience includes the valuation of business enterprises, business interests, and intangible assets for operating companies in all stages of life cycle, ESOPs, holding companies, and private equity.
Ms. von Helfenstein can be contacted at (919) 746-9027 or by e-mail to svhelfenstein@deandorton.com.