
Understanding Compensation per Work RVU
The Structure of Physician Compensation
The structure of compensation for hospital/health-system employed physicians is a constant struggle for administrators with the rise of physician practice acquisitions and subsequent employment of these physicians. Based on estimates from Jackson Healthcare1, approximately 35 percent of all physicians are employed by a hospital/health-system. As a result, the issue of how to structure and benchmark physician compensation has emerged as a leading topic among both valuators and hospital/health-system administrators. In this article, the author discusses the pros and cons of the work RVU compensation model, the most popular model.
 The structure of compensation for hospital/health-system employed physicians is a constant struggle for administrators with the rise of physician practice acquisitions and subsequent employment of these physicians. Based on estimates from Jackson Healthcare1, approximately 35 percent of all physicians are employed by a hospital/health-system. As a result, the issue of how to structure and benchmark physician compensation has emerged as a leading topic among both valuators and hospital/health-system administrators.
Traditionally, employed physicians have been compensated for clinical services utilizing a variety of methods including, but not limited to: base guarantees, compensation per work relative value unit (work RVU), base salary plus productivity bonuses, percentage of practice pre-compensation earnings, percentage of professional collections, and more recently, pay for performance and other value-based compensation. However, by far the most common method of structuring clinical compensation arrangements for employed physicians is productivity-based compensation. According to the 2014 Medical Group Management Association (MGMA) Physician Compensation and Production Survey: 2014 Report Based on 2013 Data2, approximately 39 percent of physicians are paid utilizing 100 percent productivity-based methods.
Work RVU Compensation Models
The basic premise of work RVU compensation models is to align the physician’s compensation to the productivity of the physician (as measured by work RVU). This is typically completed by utilizing independent physician compensation surveys and analyzing the expected productivity of the physician. The three most commonly utilized physician compensation surveys to accomplish this task are as follows:
- American Medical Group Association (AMGA) Medical Group Compensation and Financial Survey
- MGMA Physician Compensation and Production Survey
- Sullivan Cotter and Associates, Inc. (Sullivan Cotter) Physician Compensation and Productivity Survey
Each survey details various production and compensation metrics and is commonly used by administrators to help evaluate the competitiveness of compensation levels for physicians. In addition, the three most common methods of clinical compensation arrangements utilizing work RVU are:
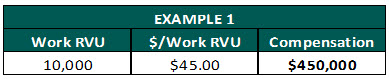
- Compensation per work RVU: Also known as an “eat what you kill” model. Physicians are paid a set dollar conversion rate for each work RVU generated.
Pros:
- Easiest model to administer
- Incentivizes physicians to produce more if wanting more compensation
Cons:
- Large downside risk for low producing physicians
- May be difficult to determine the “appropriate” compensation per work RVU rate
- The highest producers are often underpaid and the lowest producers are often overpaid in a group model
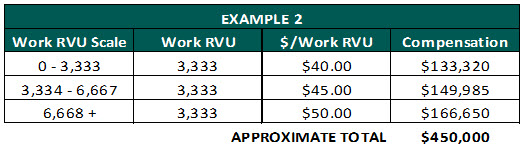
- Graduated scale: Under this model, physicians are paid dollar conversion rates per work RVU based on a graduated scale.
Pros:
- Effectively incentivizes the physician to produce more to achieve the higher compensation per work RVU rates
Cons:
- Large downside risk for low producing physicians in a group model
- Difficult to administer
- Potential of “overpaying” the physician if higher than expected productivity levels are achieved or if each individual compensation per work RVU rate is not within fair market value (FMV).
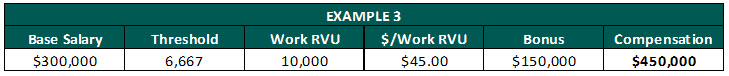
- Base guarantee plus productivity bonus: Under this model, physicians are paid a base guarantee and will receive incentive/productivity compensation for every work RVU generated above a pre-determined threshold.
Pros:
- Limit’s the physician’s downside risk by establishing a guaranteed minimum salary
- Incentivizes the physician to produce more if wanting a production bonus
Cons:
- Risk for employer if physician does not produce at a level commensurate with the base salary
- If base guarantee is set too high, the physician may not be motivated to increase current production levels
Benefits of Work RVU Based Models
Work RVU=based compensation models offer several benefits to both the employer and employee and are relatively easy to implement making them a favorite among both parties. Physicians often prefer this method as the physician’s compensation will be independent of the patient’s ability to pay or hospital/health-system’s ability to collect, thus allowing the physician to practice medicine without having to worry about billing and collecting. In addition, the physician’s compensation is not subjective to variations in healthcare reimbursement as the work RVU credit is always given regardless of the collections actually received from the patient.
Hospitals/health-system administrations often prefer this method as it incentivizes physicians to produce more, potentially leading to more revenue for the employer. The model is also relatively simple to administer and effectively rewards the highest producing physicians with the highest compensation. In addition, it allows the hospital/health-system to compensate the physicians for treating unassigned and self-pay patients which allows the hospital to serve the local community.
Nuances and Misapplication
As previously discussed, work RVU-based compensation models are the most common arrangement. However, this does not mean it is the easiest solution to implement correctly and that there are no nuances when setting physician compensation arrangements. Although work RVU-based models effectively account for the productivity of the physician, the models do not account for:
- Level of reimbursement in the local market place
- Physician’s payor mix and negotiated commercial contracts
- Return to the owner of the practice
- Actual professional collections
- Cost incurred by the physician and cost efficiencies
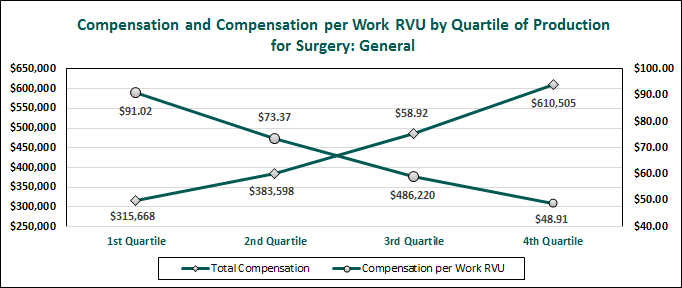
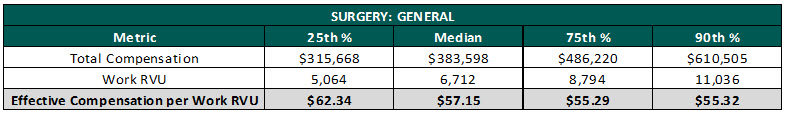
In addition, MGMA has noted for several years the difficulty in knowing how to adequately reward the highest producing physicians without overpaying and creating possible healthcare compliance issues. The difficulty arises due to the unique relationship between compensation and production; more specifically, the inverse relationship between compensation and compensation per work RVU rates. As shown in the chart below for general surgeons, compensation per work RVU decreases, but compensation increases from the first quartile to the fourth quartile.
2014 MGMA Physician Compensation and Production Survey: 2014 Report Based on 2013 Data
The declining pattern in the compensation per work RVU by quartile of production data denotes that compensation per work RVU rates do not necessarily correspond to total compensation. In theory, one would intuitively think that the compensation per work RVU rates would eventually increase with increased production as the fixed costs of the physician would eventually be covered, thus creating an increasing profit margin per work RVU. However, the survey data does not reflect this pattern. As a result, the survey data is commonly misapplied resulting in compensation arrangements that may not be fair market value (FMV).
For example, a general surgeon producing at the 90th percentile of work RVU (11,036) should not necessarily make the 90th percentile compensation per work RVU rate. As the chart below indicates, paying a general surgeon who is producing at the 90th percentile the 90th percentile compensation per work RVU rate ($91.02), would result in compensation 39.2 percent higher than the 90th percentile compensation from the MGMA survey data.

In addition, the chart below illustrates the effective compensation per work RVU rates decreases as the physician becomes more productive. What this means is that physicians producing above the median work RVU should not necessarily make above the median compensation per work RVU rate. This is a very frustrating concept to grasp as most people would assume a highly producing physician should make more per work RVU than a lower producing physician.
But what causes this disparity? In order to fully understand this concept, one must first understand how the data is derived in the MGMA survey. The compensation per work RVU rates are derived by dividing the total compensation for the physician by the physician’s total work RVU. This means that the physician whose total compensation is reported at the 90th percentile does not necessarily mean he/she is earning a 90th percentile compensation per WRVU rate. In addition, the MGMA survey does not actually detail “reported” compensation per work RVU rates from physicians who are compensated under such an arrangement. As a result, the survey data is potentially skewed by physicians who are paid base salaries that do not necessarily correlate with their actual production. For example, a newly hired physician normally has a “ramp-up” period for a few years. During this time, it is not uncommon for the physician to receive a base salary and once the physician has built up his/her practice the physician will be switched to a productivity=based model. Another plausible explanation is that even at the 90th percentile of work RVU, the physician is still not producing enough revenue to account for the large fixed cost necessary to run a physician practice. It is important to note, this concept is still being researched and a single answer has not yet been developed.
Key Takeaways
Physicians employed by hospitals/health-systems are subject to various regulations including that compensation paid to physicians be within fair market value (FMV). As a result, hospital/health-system administrators should ensure physician compensation arrangements are within FMV by seeking an independent valuation firm to provide an opinion of value. In addition, if the proposed compensation arrangement is based on a work RVU method, remember the following:
- Expected productivity of the physician should be tested to the proposed compensation plan to see if the resulting compensation is in line with the reported survey data/
- An inverse relationship exists between work RVU volume and compensation per work RVU/
- Paying a highly productive physician above the median percentile based on reported compensation per work RVU rates may result in compensation outside of FMV
- Work RVU utilized in the calculation of the physician’ compensation should:
-
- Be personally performed by the physician
- Not include midlevel production
- Be based on work RVU and not RVU
- Include modifiers
- Include a work RVU fee schedule for the appropriate locality and year
- Seek out an independent valuation firm if there is any concern that the proposed compensation arrangement is not within FMV.
Conclusion
As the amount of physicians employed by hospital and health-systems continues to increase, the importance of structuring physician compensation arrangements that are within FMV are also increasing. Productivity=based models are still the most often utilized method of structuring physician compensation arrangements. However, these methods are also some of the most misapplied compensation models due to the inherent inverse relationship between compensation and productivity. With a better understanding of this relationship and the assistance of an independent valuation expert, developing a competitive and compliant physician compensation arrangement should be an easier and less stressful process.
Sources:
- A Profile of Physicians’ Practice Environments by Jackson Healthcare
- Source: MGMA DataDive Provider Compensation 2014. Used with permission from MGMA, 104 Inverness Terrace East, Englewood, Colorado 80112. 877.275.6462. www.mgma.com. Copyright 2014. Please visit the MGMA Data Insights page, available at: https://www.mgma.com/data, to learn more about MGMA DataDive®.
Bartt B. Warner is a Senior Analyst with VMG Health and is based out of VMG Health’s Nashville office. Mr. Warner can be reached at (615) 777-7300 or by e-mail at BarttW@vmghealth.com.
Related posts
-

Healthcare Spending Projected to Exceed $8.5 Trillion by 2033
-

The Perfect Healthcare Storm
-

Multispecialty Surveys for Physician Compensation Released
-

Federal Judge Strikes Down Ban on Noncompete Agreements
-

2025 Proposed Physician Payment Rule
-

SCOTUS Rejects Chevron Deference
-

Congress Increases 2024 Medicare Physician Pay
-

Planning for Golden Parachute Payments
