
The Economic Balance Sheet
and its Application to Enterprise Valuation
The value of a firm must equal the value of the claims on its assets. In practice, this is generally expressed as the value FIRM = value DEBT + value EQUITY. Similarly, in a balance sheet prepared in accordance with generally accepted accounting principles (GAAP), assets = liabilities and equity. By comparison, an economic balance sheet is constructed using market values rather than amounts reported in accordance with GAAP, items included are classified as operating, non-operating, debt or equity-related rather than current or long-term, asset or liability, and it includes economic assets and liabilities not recognized under GAAP. The insights derived from these differences are useful in valuing an enterprise and understanding how its value is affected by the relationships between its assets, capital claims, and cash flows. This article discusses how to value a firm using the economic balance sheet.

[su_pullquote align=”right”]Resources:
The Three Valuation Approaches—Challenges and Issues
Trending Matters in Business Valuation
Valuation of Distressed Businesses and Plan of Reorganization
[/su_pullquote]
The value of a firm must equal the value of the claims on its assets. In practice, this is generally expressed as the value FIRM = value DEBT + value EQUITY. Similarly, in a balance sheet prepared in accordance with generally accepted accounting principles (GAAP), assets = liabilities and equity. By comparison, an economic balance sheet is constructed using market values rather than amounts reported in accordance with GAAP, items included are classified as operating, non-operating, debt or equity-related rather than current or long-term, asset or liability, and it includes economic assets and liabilities not recognized under GAAP. The insights derived from these differences are useful in valuing an enterprise and understanding how its value is affected by the relationships between its assets, capital claims, and cash flows.
Use of Market Value
GAAP permits the use of various measurement bases, the most common of which are historical cost and fair value. With historical cost, firms account for assets based on the initial acquisition price, and for liabilities based on the cost of the product or service received in exchange. Fair value, defined as the “price that would be received to sell an asset or paid to transfer a liability in an orderly transaction between market participants at the measurement date,” is used for financial assets, and for non-financial assets and liabilities reported at fair value on a recurring basis.
Though the definition of fair value for financial reporting is similar to fair market value, there are subtle differences between the two that can result in not so subtle differences in value. Unlike fair market value, which contemplates an open and unrestricted market, fair value only considers participants in the principal or most advantageous market, and who already own the asset or owe the liability. Fair value also differs in that it may account for synergies and for characteristics specific to a particular buyer or seller, and that it is an exit, rather than entry price. Additionally, fair value refers to the value of an asset or liability as of a specific measurement date rather than a potential date in the future.
Balance Sheet Classifications
Core Business Operations
Assets that are essential to the operations of a company and could not be divested without impairing the ability of the firm to operate its primary business are classified as core business operations (CBO). Within this category are monetary assets such as accounts receivable and required cash, physical assets like inventories, property, plant and equipment, and intangible assets including intellectual property. CBO are valued as an ongoing business rather than individually as the value of a going concern is a function of the value created by a firm’s operating assets acting together in combination, which includes the value of growth opportunities.
Non-interest bearing operating liabilities, including trade payables, taxes payable, and unearned revenues, are also part of core operations. These liabilities arise when a firm is not required to pay cash for an operating expense in the same period the expense is incurred, or receives payment in advance of providing a good or service. Non-interest bearing liabilities are not considered separately in valuing CBO; however, since in valuing a going concern, they are netted against the firm’s current assets in calculating its investment in non-cash operating working capital. The reason for this is that when a firm buys a product on credit, the interest charge is buried in the cost of the product and cannot be readily separated from the costs of operations.
Non-Operating Assets
Assets that are not needed or more than that required to operate the business being valued are non-operating, or excess assets (NOA). Examples include excess cash and marketable securities, contingent assets, nonconsolidated subsidiaries, equity investments in other firms, discontinued operations, finance subsidiaries, net operating losses, joint ventures, real estate, and net pension assets. As such, NOA are, in general, comprised of either marketable securities, which are marked to market, or illiquid assets carried at cost. Unlike the valuation of a firm’s operating assets, non-operating assets must therefore be valued individually. The resulting values are then added to the value of core operations.
Debt and Debt Equivalents
In valuation, debt can be thought of as amounts that are contractually owed to other parties and that bear explicit or implicit interest that is measureable. Liabilities meeting this criteria include commercial paper, notes, mortgages, fixed and floating bank loans, bonds, and capitalized leases. Claims treated as debt equivalents include underfunded pension liabilities and postretirement medical benefits, long-term operating reserves for plant decommissioning costs, non-operating reserves for restructuring charges and contingent liabilities stemming from environmental and product liability claims.
Off-balance sheet debt includes operating leases, unconditional purchase obligations, and special purpose entities. Companies that lease their assets using operating leases can record the lease expense as rent in operating expense rather than capitalizing it as debt. Similarly, unconditional purchase obligations (i.e., take-or-pay or throughput contracts) to transfer funds in the future for fixed or minimum amounts or quantities of goods at fixed or minimum prices need not be recorded. Special purpose entities are, in turn, used to isolate and transfer risk from a firm’s balance sheet to another entity, and in the case of securitized trade receivables, obtain financing at rates lower than other forms of debt.
Other Capital Claims
Other capital claims (OCC) include all claims on the firm’s assets not included elsewhere. This includes preferred stock, employee stock options, warrants, and minority interest. Preferred stock is a type of security which entitles the owner to a fixed claim on the firm’s assets. Dividends to preferred stock typically must be paid ahead of dividends to common equity, though preferred shares usually do not have voting rights. While junior in priority to debt, preferred stock is more like unsecured debt than equity for an established firm.
Firms frequently compensate employees with equity-based compensation. In a stock option program, employees receive options granting them the right to purchase a specified number of shares at a specific price over a certain period. A stock appreciation right entitles the employee to receive the value of the appreciation in the value of the stock between the grant and expiration dates, either in the form of cash, stock, or preferred stock. In addition, a firm may compensate employees with restricted stock or restricted stock units. With restricted stock, employees receive stock that cannot be sold until whatever restrictions in place are lifted. No stock is issued with the grant of restricted stock units. The grant is satisfied with company stock or cash when considered appropriate.
A stock warrant is like a call option in that it is a derivative security that grants the holder the right, but not the obligation, to buy a specified number of shares at a specified price on or before a certain date. Unlike call options that are issued by investors to each other, however, a warrant is issued by a firm. The result is that the value of the firm’s equity per share is diluted.
When a parent company owns more than 50 percent of a subsidiary, it must consolidate the subsidiary’s financial statements with its own. Where the amount owned is less than 100 percent, however, the parent reports a deduction for the income or loss and common equity attributable to the ownership interest in the subsidiary that it does not own. This amount is referred to as minority interest.
Common Equity
Common equity (CE) is the residual claim in the firm’s value after all other claims have been satisfied. Notwithstanding, holders of CE typically control the firm, and elect the board, who in turn hires management.
Inclusion of All Economic Assets and Liabilities
Assets and liabilities do not need to meet the criteria for recognition under GAAP to be included in an economic balance sheet. Rather, any economic resource or claim that would affect how much a buyer might pay for the firm should be counted. Environmental liabilities, which are recognized under GAAP only when it is probable that a liability has been incurred and the amount can be reasonably estimated, is one such example. Contingent assets associated with the proceeds from lawsuits, which are not recorded even when they are probable and can be estimated, is another.
Relevance to Enterprise Valuation
As Figure A below illustrates, core business operations and non-operating assets produce cash inflows for the firm, while debt, other capital claims, and common equity lead to cash outflows.
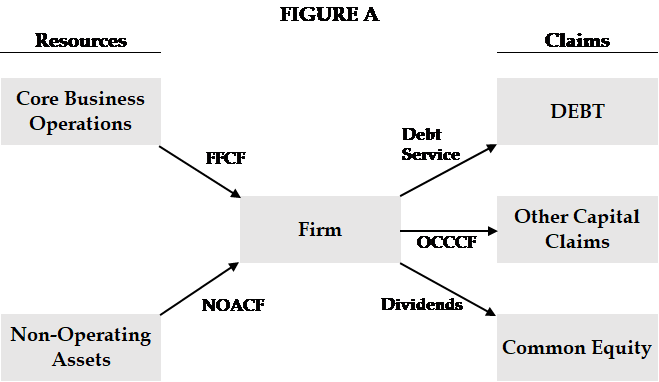
Of equal import, it can be seen that the total value of claims, namely debt and debt equivalents, other capital claims, and common equity, is equal to the total value of assets, which equals the sum of core business operations and non-operating assets, i.e.:
(1) CBO + NOA = DEBT + OCC + CE.
Rearranging terms yields the equation for the value of common equity, where:
(2) CE = CBO + NOA – DEBT – OCC.
Applying this relationship to valuation depends on the method used. The value of common equity may be estimated directly using the dividend discounted cash flow method, while in the other four methods used, its value is a function of the cash flow and or values of the other claims in the equation. Each method will produce the same indication of value given the same assumptions, albeit with a different focus and perspective regarding elements that affect the value of the firm.
CBO generates firm free cash flow (FFCF), which is the net of operating profit, taxes, working capital, and capital expenditures. NOA produces non-operating cash flow (NOACF) from items including dividends, interest, tax benefits (NOLs), and law suit settlements. Debt creates obligations to make interest and principal payments (DEBT SERVICE). OCC gives rise to other capital claim cash flows (OCCCF).
Dividend Discounted Cash Flow Method
With the dividend discounted cash flow model, the value of equity is equal to the present value of dividends paid to common shareholders. Expected dividends are forecasted and discounted back to present value as of the valuation date using the cost of equity capital. The only cash flows considered in the dividend discount model are the cash dividends to common equity, where:
(3) CE = DIVIDENDS
Equity Discounted Cash Flow Method
In the equity discounted cash flow method, the value of common equity is equal to the value of the free cash flows to equity, discounted to present value at the cost of equity capital. Equity free cash flow is measured as the cash flow remaining after all cash flows have been paid to, or received from, other claims, rather than the stream of dividends per se. The calculation of equity free cash flow can therefore be expressed as:
(4) EFCF = FFCF + NOACF – DEBT SERVICE – OCCCF.
The value of CE is then equal to the present value of EFCF shown in \equation 4. However, unlike the WACC and adjusted present value methods discussed below, the equity discounted cash flow method requires that the proportion of the firm financed with non-equity claims and amount of payments to each be known each year, the former to calculate the cost of equity, the latter to calculate EFCF. While this may make the exercise superfluous since given this information the value of the firm is already known, analysis of equity free cash flow can provide insights regarding the viability of capital strategies, ability to pay dividends, firm capital requirements, and equity risk.
Adjusted Present Value Method
An important inference from the economic balance sheet is that the value of a firm is equal to the value of its unlevered assets plus the value created from financing. In this respect, the adjusted present value method (APV) is useful in highlighting the value created by financial leverage. The value of a firm’s unlevered assets is equal to the FFCF produced by its CBO, discounted to present value at its unlevered cost of equity capital. The value created from financing is equal to the expected interest tax shields (ITS), discounted to present value at the cost of debt if the risk is that the firm may not produce income sufficient to realize the benefits, or at the unlevered cost of equity presuming a constant target capital structure, in which case the risk is that the amount of debt and associated ITS will vary with the value of the firm. The values of non-operating assets, debt and other capital claims, estimated separately by means of appraisal, observed market prices, and or cash flow models, are then added or subtracted to calculate CE as illustrated in equation 5.
(5) CE = (FFCF + ITS) + NOA – DEBT – OCC
Weighted Average Cost of Capital Method
Like the APV method, the value of a firm’s unlevered assets using the weighted average cost of capital method (WACC) is equal to the FFCF produced by its CBO, discounted to present value. In contrast to the APV method, however, the WACC method calculates the present value of the unlevered assets and interest tax shields together by adjusting the discount rate for the interest tax shield. The result is the WACC, which will be lower than the unlevered cost of equity capital if interest tax shields create value. If so, the value of CBO will also be higher. The values of non-operating assets, debt, and other capital claims (estimated separately as with APV) are subsequently added or subtracted to the present value of FFCF to calculate CE as shown in equation 6.
(6) CE = FFCF + NOA – DEBT – OCC
Residual Income Method
The residual income method differs from others in that accounting earnings and the book value of total invested capital are used in place of free cash flow and cash investment. If correctly executed, however, the residual income method yields the same value as the DCF method given that it adjusts for accrual accounting related timing differences between a firm’s earnings and free cash flows over the life of the firm. As implemented, residual, or excess income (RI) is equal to projected CBO accounting earnings minus the required return on CBO. The required return on CBO is equal to the product of the cost of capital and the book value of CBO at the beginning of the period. To calculate the value of CBO, the book value of CBO (BVCBO) as of the valuation date is added to the present value of the expected RI over the forecast period. The value of CBO is then adjusted by adding or subtracting the separately estimated values of NOA, DEBT, and OCC to calculate CE per equation 7.
(7) CE = (BVCBO + RI) + NOA – DEBT – OCC
Summary
An economic balance sheet differs from a GAAP balance sheet in that it is prepared using market values, items included are classified as operating, non-operating, debt or equity-related, and it includes economic assets and liabilities. The total of DEBT, OCC, and CE is equal to the sum of CBO and NOA. CBO and NOA generate cash inflows for the firm, while DEBT, OCC, and CE result in cash outflows. Applying these relationships to valuation depends on the method. Each will result in the same value given identical assumptions. The dividend discounted cash flow model discounts expected dividends. The equity discounted cash flow method discounts cash flow remaining after all other claims are satisfied. The APV, WACC, and RI methods share that the values of NOA, DEBT, and OCC are measured separately by means of appraisal, observed prices, or cash flow models, while CBO are valued by forecasting and discounting the related cash flow streams. They differ in that: 1) the APV method discounts forecasted FFCF at the unlevered cost of equity and adjusts the result for the value created from financing; 2) the WACC method discounts forecasted FFCF at the WACC; and 3) the RI method restates free cash flow in terms of RI and adds the discounted value of RI to the book value of CBO.
This article appears with permission from the Association of Insolvency and Restructuring Advisors (AIRA). It was originally published July 12, 2017 in AIRA Journal, Vol. 31 No. 2; available online at https://www.aira.org/journal.
Boris J. Steffen, CPA, ASA, ABV, CDBV, CGMA, is Director and Southeast leader of Financial Investigations and Dispute Advisory Services at RSM US LLP. An expert in accounting, finance and valuation, his experience includes testifying as to the fair value of BMC Software, Inc.’s equity in Delaware Chancery Court, merger efficiencies in the Sirius XM Satellite Radio merger litigation and proposed Exelon Corp/PSEG merger, and merger efficiencies, pricing and profitability in FTC v. Staples/Office Depot. Mr. Steffen also advised on damages in the Vulcan Materials/Martin Marietta hostile takeover battle, Enron bankruptcy, and Vitamins and AMD/Intel antitrust cases, fair value in the Xerox/ACS merger and bankruptcies of Exide Technologies and Energy Future Holdings; and solvency in the Namco Capital, Frank Parsons, and Circuit City fraudulent transfer and preference actions.
Mr. Steffen can be reached at (703) 336-6303 or by e-mail to Boris.Steffen@rsmus.com.
Related posts
-

The Perfect Healthcare Storm
-

Tariffs and Uncertainty
-

Why Strong Internal Controls Are Essential
-

The Macroeconomics of U.S. Tariffs, Global Retaliation, and Shifting Trade Dynamics
-

Legal Update: May 2025
-

Understanding the Income Approach
-

Shannon Pratt’s, The Lawyer’s Business Valuation Handbook 3rd Edition
-

Enterprise Value vs. Market Value of Invested Capital
