
Analyzing Transactional Databases
Issues Using Transactional Databases and whether there is a Florida Effect that Biases the Transaction Multiplies
In this article, the author discusses issues that impact the transaction multiples. He warns appraisers that it is dangerous to assume that the data offered by the transactional databases is consistent from transaction to transaction and, therefore, can be combined into a single sample and then compared to the subject of the valuation. In the article, he discusses three issues. Those are: 1) the vast differences in selling prices reported by the transactional databases; 2) the distorting effect of Florida comparables; and 3) the distorting effect of comparables that do not report the value of inventory. This article is a must-read for practitioners who wish to avoid collecting samples of data that horribly skew the results of their valuations. It is even more important for those practitioners who act as expert witnesses.
![]()
[su_pullquote align=”right”]Resources:
The Use of Regression Analysis in the Market Approach
Using the BIZCOMPS® Database to Value Small Businesses
20 Valuation Databases & Resources in 60 Minutes
[/su_pullquote]
Over the last fifteen years I have spent thousands of hours researching the Pratt’s Stats, IBA, Bizcomps, and Peercomps databases trying to uncover inaccuracies and inconsistencies in the reported transactional data. Too often appraisers assume that the data offered by the transactional databases is consistent from transaction to transaction and, therefore, can be combined into a single sample and then compared to the subject of the valuation.
Three issues will be discussed in this report: 1) the vast differences in selling prices reported by the transactional databases; 2) the distorting effect of Florida comparables; and 3) the distorting effect of comparables that do not report the value of inventory. These are situations which most appraisers are either not aware of or hope that their readers are not aware of. In either case, this article is a must-read for practitioners who wish to avoid collecting samples of data that horribly skew the results of their valuations. It is even more important for those practitioners who act as expert witnesses. Armed with this information, an expert witness can easily discredit any opposing expert’s valuation.
Selling Price[1]
Bizcomps, IBA, and Peercomps all report that the selling prices for transactions listed in their respective databases are asset sale values or that have been converted to asset sale values.[2],[3] An asset sale value is generally considered to be the value of a company’s three main assets: fixtures and equipment (FF&E), inventory, and goodwill. Pratt’s Stats’ procedural manual defines market value of invested capital (MVIC) as: “the total consideration paid to the seller and includes any cash, notes, and/or securities that were used as a form of payment, plus any interest-bearing liabilities assumed by the buyer.” The MVIC price includes the noncompete value and the assumption of interest-bearing liabilities and excludes: 1) the real estate value; 2) any earnouts (because they have not yet been earned, and they may not be earned); and 3) the employment/consulting agreement values.[4] Thus, it is possible that the mix of assets or liabilities comprised in MVIC might be significantly different than the three assets in an asset sale value.
Most smaller companies with revenues less than, say, four million dollars are sold as asset sales. However, in many of the smaller transactions listed by Pratt’s Stats, the submitting brokers did not identify the value of the assets being transferred. As a result, we are left with the assumption that MVIC equals an asset sale value which might not always be the case. For larger companies with revenues in excess of, say, four million dollars, various combinations of assets and liabilities are often acquired by the buyer. Hence, MVIC for these larger transactions is frequently different than an asset sale value. However, the transactional data for many of those sales may enable the appraiser to reconcile MVIC to an equivalent asset sale value.
MVIC often takes on many different forms that can be significantly different from asset sale values. In fact, there are at least five different variations of selling prices that are identified as MVIC in the Pratt’s Stats database. An asset sale price is by far the most common. However, four other possible MVIC variations that are not conventional asset sale values (transactions “b” to “e” in Exhibit I) are radically different from each other. Those transactions should not be included in the same sample with other transactions where an asset sale value is the desired conclusion of value. If left in a sample, the resulting valuation may be significantly skewed.
Exhibit I shows a typical balance sheet of a company and the combination of assets and liabilities that might have been acquired by a buyer. Depending on the combinations of assets and liabilities acquired in the sale, the submitting broker might have reported a selling price ranging from $2,200,000 to $3,700,000. Bizcomps and IBA attempt to reconstruct the broker’s selling data to reflect an asset sale price; Pratt’s Stats does not. All five of the variations in Exhibit I would be identified as MVIC in the Pratt’s Stats database. As we can see, the resulting cash flow multipliers (selling price ÷ cash flow) for each transaction are significantly different as are the revenue multipliers (selling price ÷ revenue).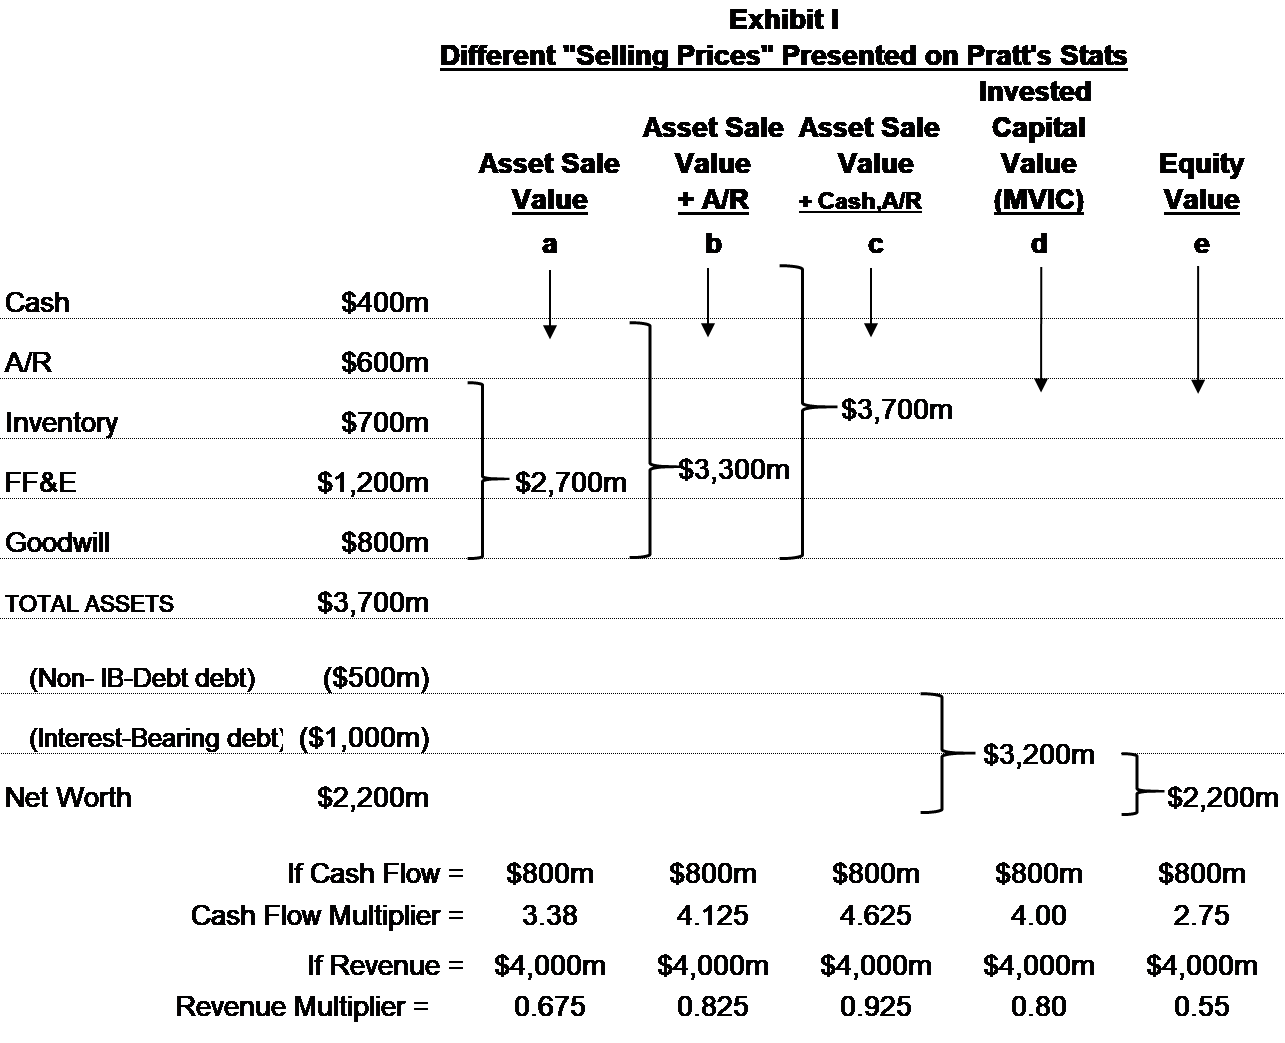
If we assume that the company in Exhibit I generated $800,000 in cash flow, the cash flow multiplier for an asset sale (transaction “a”) would be 3.38 ($2,700,000 ÷ $800,000) and the revenue multiplier would be 0.675 ($2,700,000 ÷ $4,000,000). If the buyer acquired all the assets of the company (as in transaction “c”), the submitting broker might report the selling price as $3,700,000. Hence, the resulting cash flow multiplier would be 4.625 and the revenue multiplier would be 0.925. The multipliers from transaction “c” are over 36% higher than the multipliers for an asset sale. Consequently, if an appraiser collected a sample of nine transactions which reported asset sale values (as in transaction “a”), and then added transaction “c” to the sample, the resulting average multiplier of the sample would be increased, thus overstating the value of the subject.
In the last two years, Pratt’s Stats has made great strides in reporting the value of the assets and liabilities that were transferred in a transaction. Over 50% of the 27,500 transactions listed in Pratt’s Stats database now have a purchase price allocation data section listing all the assets and liabilities that were transferred to the buyer. Additional information regarding the asset values of the transaction is available in the notes section. It is, therefore, critical that the appraiser read the purchase price allocation section and the notes section appended to each transaction report to obtain a full understanding of the structure of the sale.
All the comparables selected for one’s sample should be homogenous. If all the transactions in one’s sample list asset sale selling prices (as in transaction “a”), then transaction “c” must be reconciled to reflect an asset sale selling price before it can be included in the sample. Hence, in transaction “c”, one would deduct the value of cash and A/R from MVIC to arrive at an equivalent asset sale value ($3,700,000 – $600,000 – $400,000 = $2,700,000).
To illustrate the importance of reading the Pratt’s Stats notes and reconciling transactions to asset sale selling prices, I downloaded all the transactions in SIC codes 3000 to 3999 from all three databases. The objective was to determine the percentage of companies in which MVIC did not equal an asset sale selling price. The selling prices from the Bizcomps and IBA databases were reconciled to include FF&E, inventory, and goodwill, and exclude earnouts and employment contracts. (Note: I added the value of inventory to Bizcomp’s selling prices to be comparable to IBA and Pratt’s Stats’ asset sale prices.) Hopefully, those selling prices will match Pratt’s Stats MVIC. Of the 2,474 transactions found with those SIC codes, 1,120 were from the Pratt’s Stats database, 381 from Bizcomps, 291 from Peercomps, and 682 from IBA.
Of the 1,120 Pratt’s Stats transactions, 10% (111) had duplications in Bizcomps or IBA. Since IBA and Bizcomps only report asset sale selling prices, if Pratt’s Stats’ MVIC matches IBA’s or Bizcomps’ selling price, we can assume that MVIC is also an asset sale price. Upon inspection of the duplications, I found that 37% of the Pratt’s Stats MVIC values did not match the corresponding asset sale price of IBA or Bizcomps. Fortunately, from the purchase price allocation data included in the Pratt’s Stats transaction reports, I was able to reconcile all but 13% of the transactions to an equivalent asset sale price.
Of critical importance are transactions that are listed as stock sales. Of the 1,120 Pratt’s Stats transactions analyzed, 111 were duplications; however, only eight of those were stock sales. There were an additional 455 Pratt’s Stats transactions that were listed as stock sales of which 212 had no purchase price allocation. The remaining 243 contained purchase price allocation data that enabled us to reconcile the transactions to an equivalent asset sale selling price. After reconciling the 243 stock sale transactions, I found that 78% had MVIC values different from a reconciled asset sale price. We can probably assume that those stock sale transactions that had no allocation data will have a similar percentage of MVIC values that do not match the equivalent asset sale value. Thus, between the stock sales and duplications we found where MVIC did not match an asset sale price, we might expect that as much as 35% of the Pratt’s Stats database has MVIC values that are different from asset sale values.
Hence, it is imperative that an appraiser reads the notes and allocation data in the transaction reports to reconcile MVIC to an equivalent asset sale price if an asset sale price is the desired conclusion of value. Failing to do so means that possibly 1/3 of your sample many contain inflated MVIC values that will skew your resulting multipliers. Even if one made all the possible adjustments for asset sale prices, a typical sample of 20 to 30 transactions will undoubtedly still have a half dozen or more MVIC values where no allocation data was available. Odds are that several of them had MVIC values that were not asset sales values. Using median to determine the samples’ multipliers may eliminate the effect of these outliers. But the better solution is to eliminate all Pratt’s Stats transactions that cannot be reconciled to asset sale values.
Regardless, the appraiser is cautioned that when the MVIC value for a transaction cannot be reconciled and looks too good to be true, it probably is and, therefore, should be rejected. In addition, since the high percentage of stock sale transactions have MVIC values that were not asset sale values, all stock sale transactions should be rejected when the appropriate purchase price allocation data is not available.
Exhibits V and VI show examples of reconciling Pratt’s Stats transaction reports to obtain asset sale values.
The “Florida Effect”
The Florida Business Broker Association (BBF) has been an enviable model of business broker cooperation. However, it is my understanding that brokers who are part of the association must report the transactional information from each of their sales to the BBF before they can receive their commission. Hence, BBF collects a huge volume of transactional data which it then sells to the various databases, but does not audit these for accuracy. Over the last ten years, 49% of Bizcomps’ transactions, 39% of Pratt’s Stats’ transactions, and 28% of IBA’s transactions have come from BBF. Peercomps obtains most of its data from SBA banks and only has 14% of its transactions come from Florida. The concentration is becoming so great that it is difficult to obtain samples for our valuations that do not have the appearance of a Florida bias.
However, the sheer number of Florida transactions is not the problem; the quality of the data is. Either the Florida brokers have not been properly trained in the IBBA standards for calculating seller’s discretionary earnings (SDE) or, the fact that they are forced to report every sale to the BBF before being paid means they begrudgingly submit unusable data. In conversations with Steve Mize, the owner of the Peercomps database, he indicated that his primary incentive for starting Peercomps was that the Florida data had excessively high profit margins resulting in low multiples. Exhibit II is an analysis of retail transactions found in SIC codes 5200 to 5999. When selecting other groups of SIC codes, the results were similar.
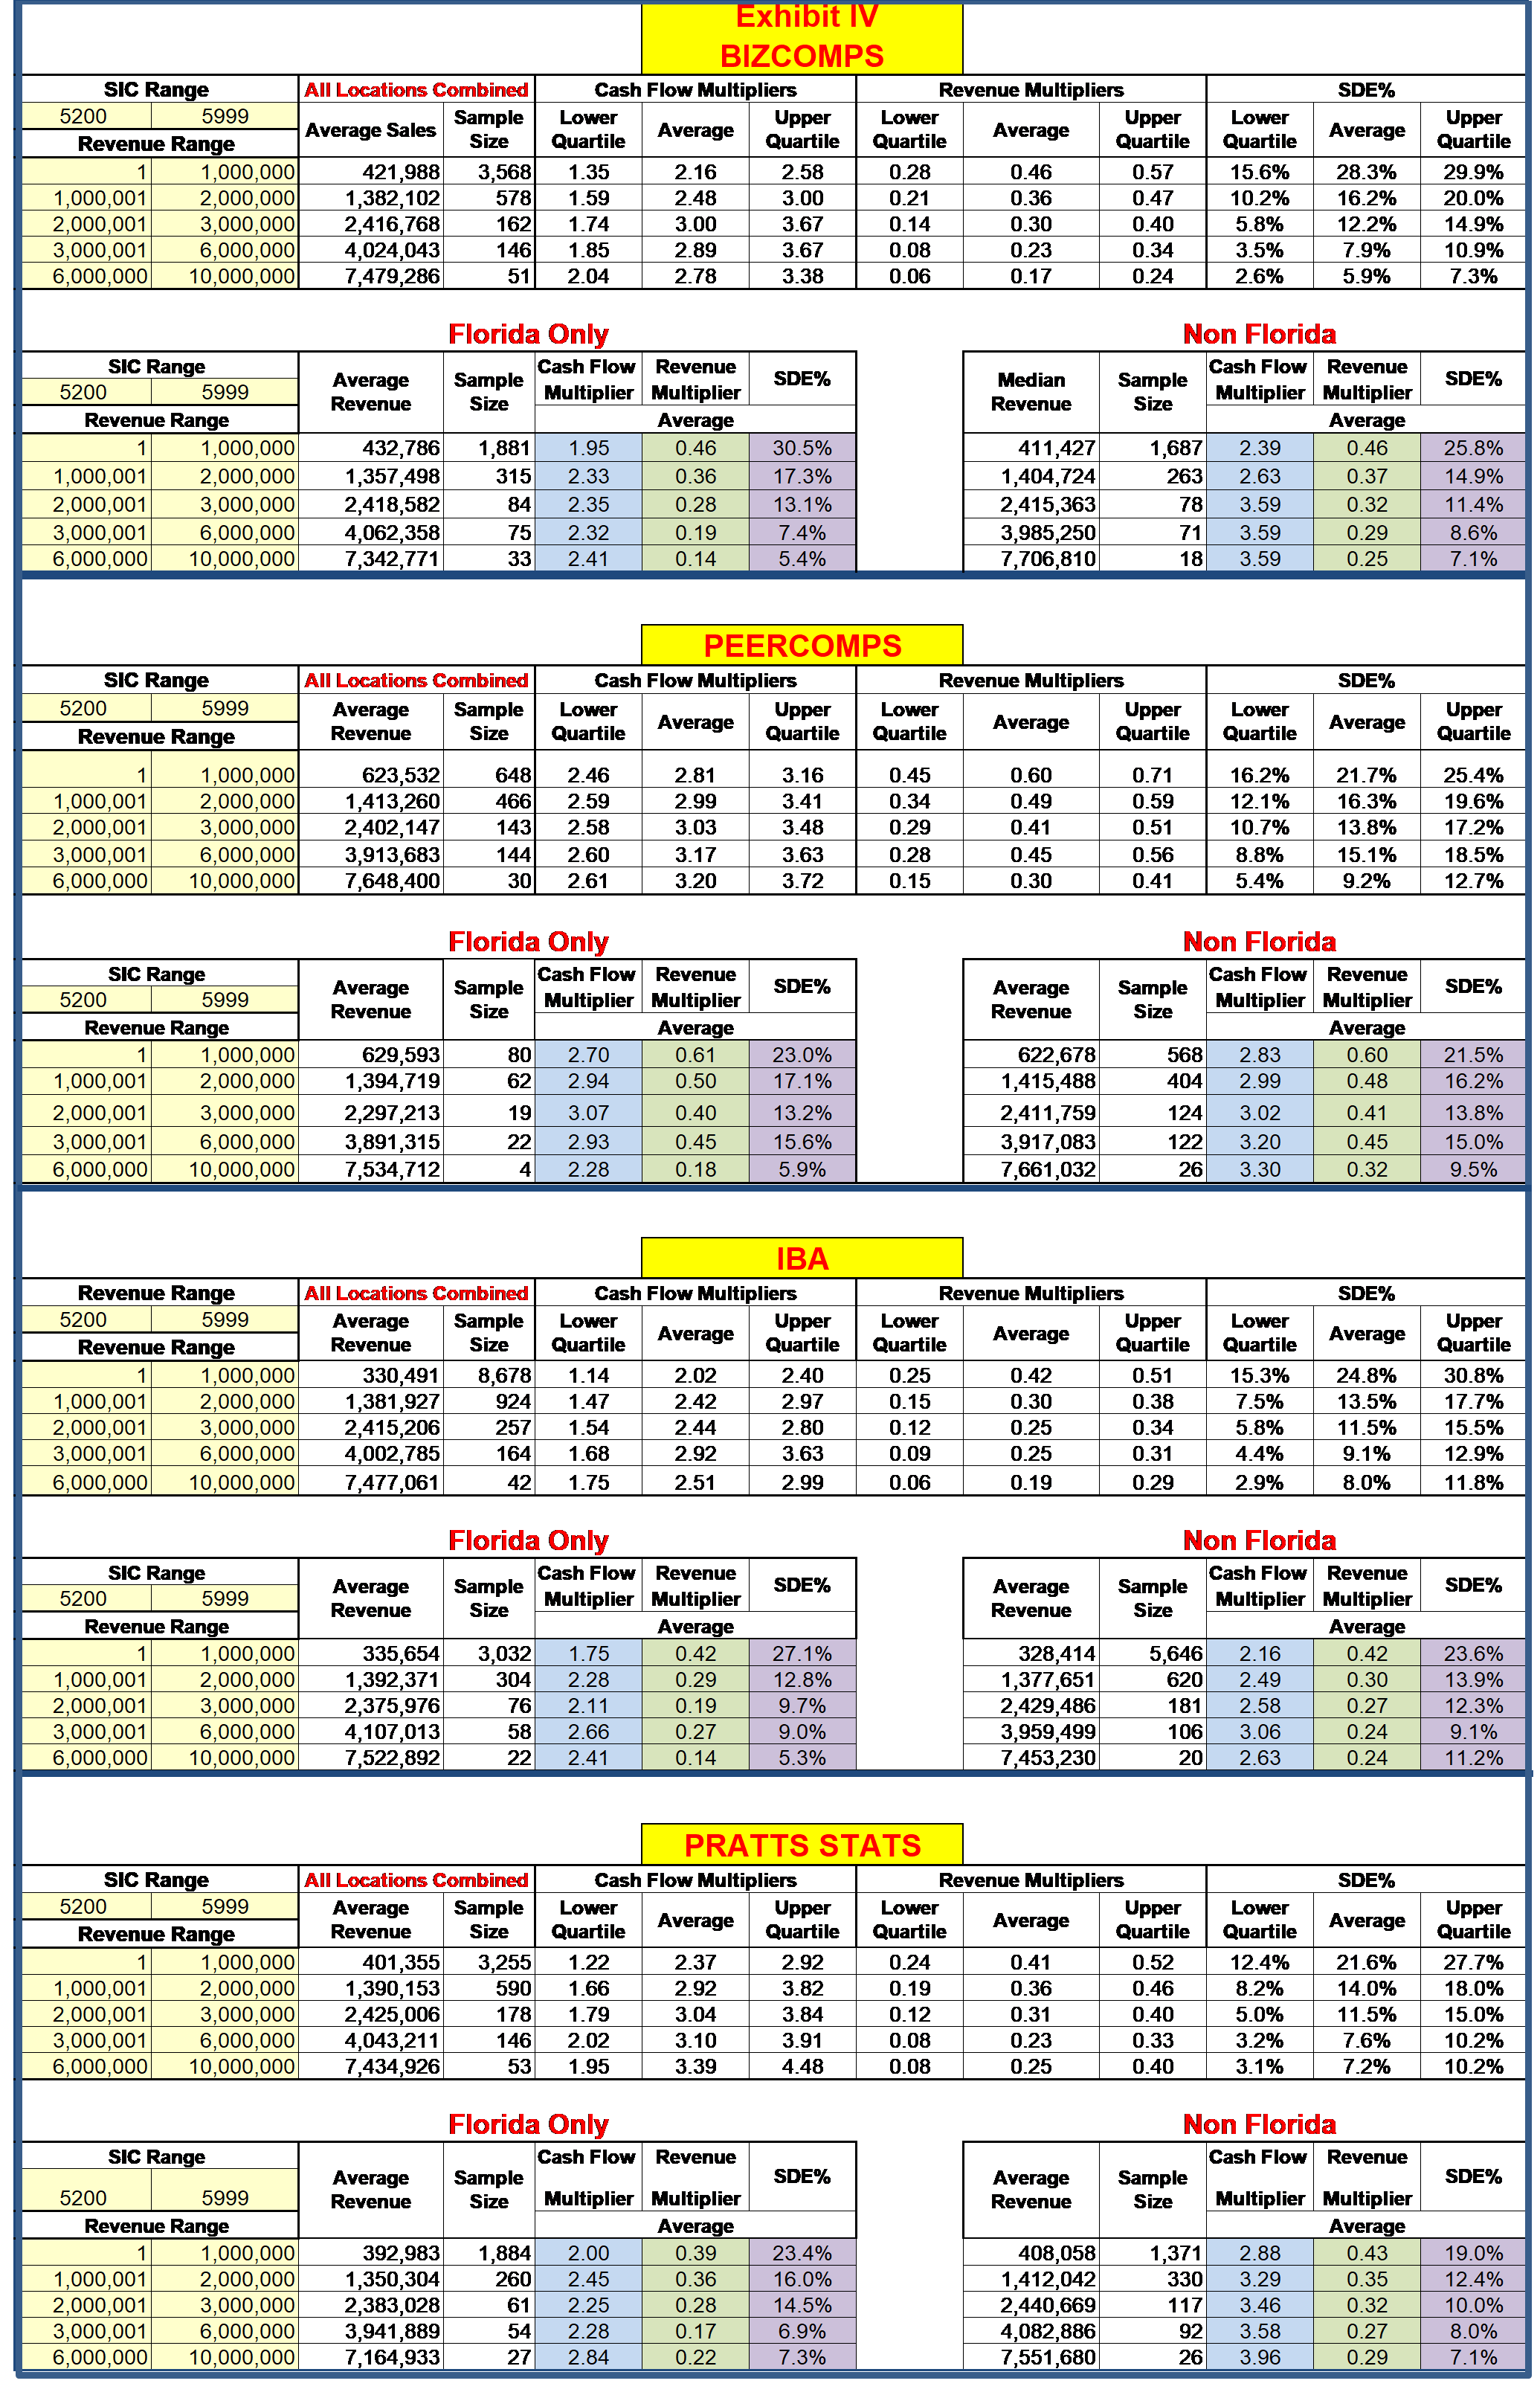
The transactions have been sorted by revenue size and grouped into Florida transactions vs. non-Florida transactions[5]. A more detailed presentation of data can be seen in Exhibit IV.
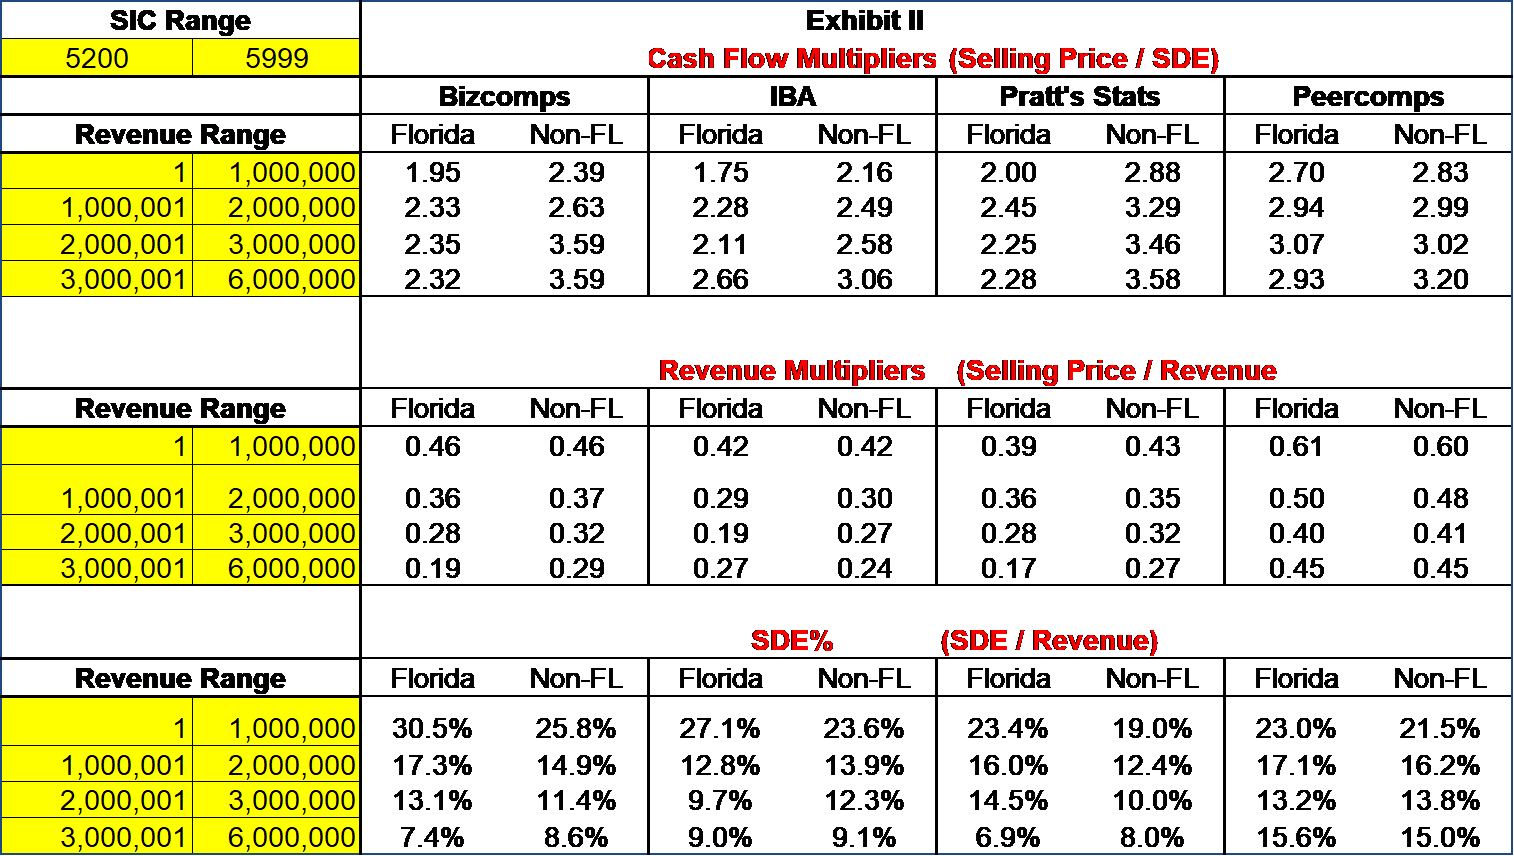
Regardless of the size of the company, all the Florida cash flow multipliers are lower than non-Florida sales; some by as much as 30% to 35%. The corresponding revenue multipliers, however, are reasonably similar regardless of location. (Some of the discrepancies observed in the two to six million dollar revenue range may be attributed to the much smaller sample sizes.) We can identify the source of the disparity in cash flow multipliers by observing the differences in the operating profit margins (SDE%) reported for Florida vs. non-Florida transactions. Florida brokers are calculating SDE much higher than all the other brokers in the country. Since Florida’s reported SDE is higher, the resulting cash flow multipliers will be lower because SDE is the denominator of the multiplier ratio (Price / SDE). Florida brokers appear to be reporting revenue and selling prices the same way as other brokers in the rest of the country as evidenced by the revenue multipliers being reasonably similar.
We can eliminate the hypothesis that Florida companies just generate more SDE than the rest of the country. Peercomps uses SBA banks rather than business brokers for its source of data. The cash flow multipliers reported by Peercomps are reasonably similar regardless of location. Peercomps’ SDE% is also similar regardless of location. Hence, the only explanation left is the Florida brokers’ faulty calculation methodology. It is clearly at odds with the rest of the country.
To avoid undervaluing your subject, where possible, I recommend rejecting all comparables from Florida.
Inventory
A great many transactions in the IBA, Bizcomps, and Pratt’s Stats databases report that there was no inventory transferred in the sale. It seems unlikely that companies such as retailers or wholesalers would not have any inventory. However, when analyzing the wholesale and retail companies in SIC codes 5000 to 5999, 44% of the 2,500 companies in Bizcomps’ database presumably sold with no inventory. Of the 5,300 companies in Pratt’s Stats database that were in SIC codes 5000 to 5999, 30% claim to have been sold with no inventory. IBA indicated that 53% of retail and wholesale companies sold with no inventory. It is inconceivable that such a large percentage of this group of companies had no inventory.
However, having been a business broker for 12 years in an office with 15 other brokers, I found that in many listings, the commissions were calculated on all assets being sold excluding inventory. The brokers instructed the buyers and sellers to handle the transfer of inventory outside of escrow by themselves and the seller typically carried back 100% of the inventory financing for 90 to 365 days. As a result, the purchase agreements indicated that the selling price did not include inventory and the escrow documents showed that no inventory was sold in the transaction, and there was also no documentation for the seller carryback. The broker then reports the selling price without inventory even though the buyer paid for the inventory in addition to the stated escrow price.
Bizcomps posts all the transactions to its database with selling prices that exclude inventory. Hence, regardless of the amount of inventory that the transaction reports indicate, the cash flow and revenue multipliers from Bizcomps data will not be materially different.
However, Pratt’s Stats and IBA present their data differently. For example, a business broker submitting transactional data to Pratt’s Stats might indicate that the selling price was $500,000, which included $100,000 in inventory, and the company’s revenue and SDE were $1,000,000 and $200,000 respectively. Pratt’s Stats would post the MVIC as $500,000 and the corresponding revenue multiplier would be 0.50 ($500,000 / $1,000,000) and the cash flow multiplier would be 2.50 ($500,000 / $200,000). However, if the broker allowed the seller and buyer to handle inventory outside of escrow, he might report the same transaction as having a selling price of $400,000 with no inventory being transferred. Pratt’s Stats would post MVIC as $400,000 in this case and, the resulting revenue multiplier would be 0.40 ($400,000 / $1,000,000) and the cash flow multiplier would be 2.0 ($400,000 / $200,000).
It is common practice for appraisers to only show the revenue, cash flow, and selling prices of transactions in their analyses and ignore inventory, fixtures, and equipment values. Hence, the appraiser and anyone reading the report will assume that the selling prices for all comparables obtained from Pratt’s Stats or IBA include inventory that was transferred in the sale.
If the appraiser only used the Bizcomps database for his sample of comparables, all the Bizcomps selling prices are reported excluding inventory. Consequently, the multipliers and the resulting values calculated from those transactions will also exclude inventory. Hence, regardless of how the business broker submitted the data to Bizcomps, the multipliers and resulting valuation would not be affected. (Note the blue cells in Exhibit III[6].)
However, Pratt’s Stats and IBA databases generally both report selling prices that include inventory and, as such, have a significant problem. (In many cases, IBA does note that inventory was not included in the reported selling price, but often provides the appraiser with the amount of inventory transferred similar to the Bizcomps presentation.) Furthermore, if the appraiser wishes to combine transactions from the Bizcomps database with either the Pratt’s Stats or IBA databases, he will first have to add the reported inventory to the Bizcomps selling prices so that they will be equivalent to Pratt’s Stats and IBA selling prices. In doing so, Bizcomps will share a fate like Pratt’s Stats for transactions reporting no inventory. (Note the green cells in Exhibit III.)
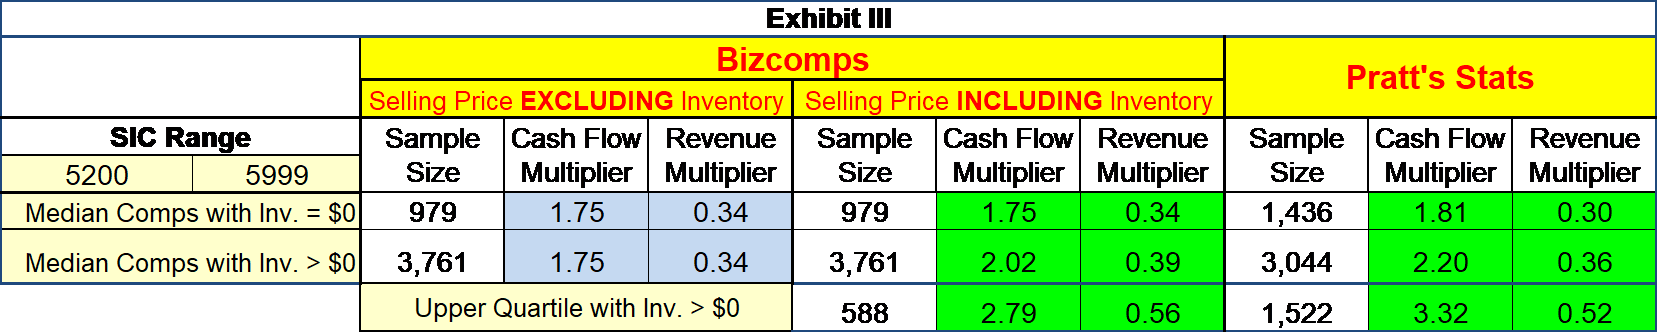
Pratt’s Stats transactions reporting selling prices including inventory produced cash flow multipliers that were up to 21% higher than the multipliers of transactions reporting no inventory (2.20 vs. 1.81). The spread between transactions with no inventory versus those with inventory increases to as much as 83% when comparing the multipliers from the upper quartile of transactions. The upper quartile of multipliers from the top 1,522 Pratt’s Stats transactions with inventory produced cash flow multipliers of 3.32 or more compared to 1.81 without inventory. In other words, at least 25% of Pratt’s Stats’ transactions with inventory had multipliers that were 83% higher than the median company without inventory. When including inventory in the selling price, the upper quartile of multipliers in the top 588 Bizcomps transactions with inventory produced cash flow multipliers of 2.79 or more compared to 1.75 without inventory—a 59% difference. Consequently, any transaction that reported no inventory being transferred can significantly skew the resulting value of the subject business.
Therefore, when valuing a business in an industry where inventory is a major asset on the balance sheet, to avoid undervaluing the business, the appraiser should reject any transaction that indicates no inventory was sold.
There are many types of businesses where inventory is an insignificant asset. Restaurants, for example, carry inventory. However, it is usually only a few thousand dollars and, it is quite conceivable that the business really did sell with no inventory. Hence, the appraiser should use his good judgement when considering rejecting companies with no inventory.
Exhibit IV is a more detailed analysis of the “Florida Effect.”
Exhibits V and VI are examples of reconciling MVIC to an asset sale value. The transaction report in Exhibit V indicates that a purchase price allocation was submitted for the sale.
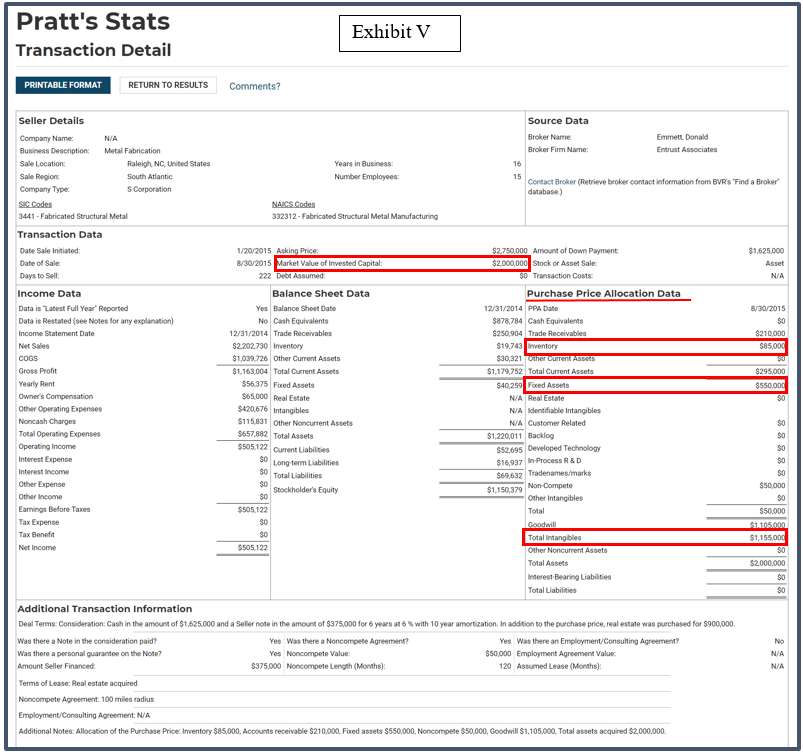
In Exhibit V, MVIC is reported as $2,000,000; however, that price included $210,000 in receivables. MVIC must be reconciled to an asset sale value which is $1,790,000 ($85,000 + $550,000 + $1,155,000).
[1] Bizcomps and Pratt’s Stats data are obtained from Business Valuation Resources website: www.bvmarketdata.com, IBA data is obtained from the ValuSource website: www.valusource.com, and Peercomps data is obtained from the Peercomps website: www.peercomps.com.
[2] Jack Sanders, “Bizcomps User Guide”, 2004, pg. 6 and 12. Bizcomps does not include inventory in its sale price. However, it is a simple matter to add the value of inventory to obtain an equivalent asset sale price.
[3] Peercomps, “How it Works\Data Gathering Process\Transactional Data,” https://www.peercomps.com/.
[4] Pratt’s Stats FAQs, “Definitions: What is the Legend for Pratt’s Stats Income Data,” from the Business Valuation Resources website, http://www.bvmarketdata.com. p. 3
[5] The samples have been filtered by eliminating all stock sales, transactions with negative SDE, and transactions with cash flow multipliers greater than 10.
[6] The data in Exhibit III has been filtered by eliminating all stock sales, transactions with negative SDE, and transactions with cash flow multipliers greater than 10.
Fred Hall III, MBA, CBA, CVA, is principal of Affordable Business Valuation, www.afforadablebusinessvaluation.com, a Jackson, California appraisal firm. He received his Bachelor of Science degree in Business from UC Berkeley and his MBA from San Diego State. In 2004, he pursued an education with the Institute of Business Appraisers (IBA) and earned the coveted Certified Business Appraiser (CBA) certification. He also holds a Certified Valuation Analyst (CVA) certification with the NACVA, the largest business appraisal association. Mr. Hall is the CEO and sole owner of Amador Appraisals and Acquisitions, Inc. During the last 15 years, he has written business valuations for over 700 companies. He has regularly presented lectures and webinars on business valuation techniques to a number of professional organizations in California and has been invited to present seminars on valuation methodologies at a number of conferences held by various national organizations.
Mr. Hall can be contacted at (209) 256-1371 or by e-mail to fred@fredhall.biz.

 and 504 Loans")


