
Intellectual Property Valuations
Illustrative Example of the Relief from Royalty Method (Part IV of V)
Previous installments of this five-part discussion summarized the development of the market approach and the relief from royalty (RFR) method of intellectual property valuation. This fourth installment presents an illustrative example of the practical application of the RFR method.

[su_pullquote align=”right”]
Intellectual Property Valuations: The Relief from Royalty Method (Part I of V)
Intellectual Property Valuations: Elements of the Valuation Analysis (Part II of V)
Intellectual Property Valuations: Application of the Relief from Royalty Method (Part III of V)[/su_pullquote]
Introduction
Previous installments of this five-part discussion summarized the development of the market approach and the relief from royalty (RFR) method of intellectual property valuation. This fourth installment presents an illustrative example of the practical application of the RFR method.
Intellectual Property Valuation Illustrative Example
Let’s consider the application of the RFR method to value a corporate taxpayer’s intellectual property for purposes of claiming an intangible property exemption related to a property tax assessment. The Alpha Pharmaceutical Company (Alpha) owns and operates a special purpose pharmaceutical product manufacturing plant located in Taxem County.
The high-technology facility is a state-of-the-art manufacturing plant. The special purpose plant is a continuous-process facility that is physically, functionally, and economically integrated. The Taxem County property tax assessor valued the Alpha plant (including all real estate and tangible personal property) at $500 million as of the January 1, 2022, assessment date.
Even though the manufacturing plant is locally assessed, the property tax assessor applied the unit principle of property valuation to value the Alpha facility. The Taxem County assessor applied both the income approach and the market approach to conclude the facility value.
Applying the income approach, the assessor capitalized the net operating income generated by the special purpose plant’s business operations. The Taxem County assessor derived the direct capitalization rate from capital market data related to publicly traded pharmaceutical companies. Applying the market approach, the Taxem County assessor multiplied the plant’s earnings before interest, taxes, depreciation, and amortization (EBITDA) by a market-derived pricing multiple.
The Taxem County assessor extracted the pricing multiple from the recent sales of going-concern pharmaceutical manufacturing facilities. The Taxem County assessor reconciled the income approach value indication and the market approach value indication and concluded the value of the Alpha special purpose facility.
Taxem County only taxes real estate and tangible personal property. That is, intangible personal property (including intellectual property) is exempt from property tax in this jurisdiction.
Alpha management believes that the assessor’s total property value conclusion includes the value of the intellectual property that Alpha owns and operates at the plant. Alpha management wants to claim an intangible property exemption related to the value of that intellectual property.
Alpha manufactures several pharmaceutical products at the Taxem County plant. However, the principal product manufactured at the plant is the patented and FDA-approved drug called Beta. Beta is an extremely effective (and extremely profitable) treatment for hypertension. Alpha management retained an analyst to value the Beta patent, proprietary technology, FDA license, and related intellectual property.
The valuation objective is to estimate the fair market value of the Beta pharmaceutical patent, proprietary technology, and related know-how that is owned and operated by Alpha at the Taxem County plant. The valuation date is January 1, 2022. Fair market value is the statutory definition of value used in Taxem County for ad valorem property tax purposes.
The valuation purpose is to assist Alpha management in its claim for an intangible property exemption related to its January 1, 2022, industrial property tax assessment.
The analyst decided to use the market approach and the RFR method to value the Beta patent, proprietary technology, and related trade secret know-how.
Illustrative Royalty Rate Search Criteria
The analyst searched for arm’s-length intellectual property license agreements from which to extract market-derived royalty rate data to use in the RFR valuation of the Beta patent. The analyst selected (and documented) the following criteria for researching CUT licenses:
- SIC code 2834, pharmaceuticals industry
- Technology intangible assets and manufacturing/process intangible assets
- Either the licensor or the licensee is a U.S. company
- No geographic territory restrictions
- No restrictions on the type of the agreement (other than it must be patent or technology related)
- License start date must be after January 1, 2017, and the license must be in effect as of January 1, 2022
The Initial License Royalty Rate Search Results
In this illustrative example, the analyst searched both the ktMINE database and the RoyaltySource database to identify pharmaceutical industry patent and technology license agreements. The analyst will apply the royalty rate data extracted from the commercial databases (1) to apply the RFR valuation method and (2) to value the Beta patent-related intellectual property.
Using the ktMINE database, the analyst’s initial search identified 72 potential CUT license agreements for further consideration. Using the RoyaltySource database, the analyst requested 30 randomly selected pharmaceutical industry technology license agreements for future consideration. The license royalty rates indicated by the 102 potential CUT licenses ranged from 2 percent of the licensee’s product revenue up to 100 percent of the licensee’s product sublicense revenue.
After reviewing each of the 102 pharmaceutical industry technology license agreements, the analyst noticed that numerous license royalty rates were expressed as:
- A percentage of licensee gross profits,
- A percentage of licensee net profits,
- Dollars per kilogram of product produced,
- A percentage of the license product manufacturing costs,
- A fixed dollar amount per time period, or
- A fixed dollar amount for the term of the license.
In selecting the appropriate royalty rate to use in the Beta patent-related valuation, the analyst had to consider over 100 divergent license royalty rate data points.
Types of License Agreements Included in the Commercial Databases
The analyst noted that there were numerous types of intellectual property agreements included in the commercial databases. In order to assemble a reasonable amount of usable pharmaceutical product patent royalty data, the analyst concluded that the following types of agreements could be eliminated (from consideration), adjusted (quantitatively normalized), or assessed (qualitatively normalized):
- Territory production/manufacturing agreements
- Territory product distribution agreements
- Sublicense agreements
- Trademark license agreements
- Intercompany transfer price agreements
- Nonpatent technology licenses
- Intangible asset sale agreements
- Joint product development agreements
- Joint venture commercialization agreements
- Access to product data and library research agreements
- Intellectual property infringement settlement and court order agreements
- Stockholder litigation settlement agreements
- Technical assistance agreements
Types of Products Included in the Commercial Databases
Even though the analyst restricted the database searches to pharmaceutical industry patents, a wide array of license agreements was captured in the royalty rate search. To achieve a manageable number of useable royalty rate observations, the analyst concluded that the following products could be eliminated (from consideration), adjusted (quantitatively normalized), or assessed (qualitatively normalized):
- Generic drug products
- Cosmetic products
- Nonhuman drug products
- Medical and surgical device products
- Radiation delivery systems
- Over-the-counter products
- Dietary supplement products
- Nonprescription skin care products
- Multiple pharmaceutical products (multiple product portfolios)
- Multiple patents and know-how (multiple intellectual property portfolios)
Types of License Compensation Included in the Commercial Databases
Ideally, the analyst identifies license agreements that have a royalty rate expressed as a percent of the licensee’s product revenue. Such royalty rates are easier to apply in the RFR method. And such royalty rates would be easy to apply to the valuation of the Beta patent, proprietary technology, and related know-how intellectual property.
The analyst’s initial search of the 102 license agreements produced a very wide range of royalty rate compensation formula, plans, and methods. In order to achieve a reasonable number of useful royalty rate observations, the analyst decided that these license royalty consideration arrangements could be eliminated (from consideration), adjusted (quantitatively normalized), or assessed (qualitatively normalized):
- A profit split percentage of the licensee gross profits
- A profit split percentage of the licensee net profits
- A profit split percentage of the licensee product profits
- A percentage of the sublicensee revenue/income
- A percentage of the licensee product manufacturing costs
- A percentage of the licensee total costs
- A percentage of some specified exit event price or consideration
- A percentage of the FMV assigned to the subject intellectual property
- A dollar amount per unit volume/weight of product produced
The analyst noted that some of these license consideration arrangements could be useful in the application of profit split valuation methods or of cost-plus valuation methods. However, these license consideration methods were not particularly useful to the application of the RFR method.
The analyst also noted that, with some supplemental analysis, some of these license consideration arrangements could be converted into a percent of revenue royalty rate equivalent—that could be used in the application of the RFR method.
Examples of the Elimination of Royalty Rate Noise
Exhibit 8 illustrates several of the license agreements that the analyst had to eliminate from future consideration. The type of license agreement compensation arrangements did not lend themselves to use in the RFR method.
Exhibit 8: Alpha Pharmaceutical Company | Beta-Patent-Related Intellectual Property Valuation | Elimination of Royalty Rate Observations
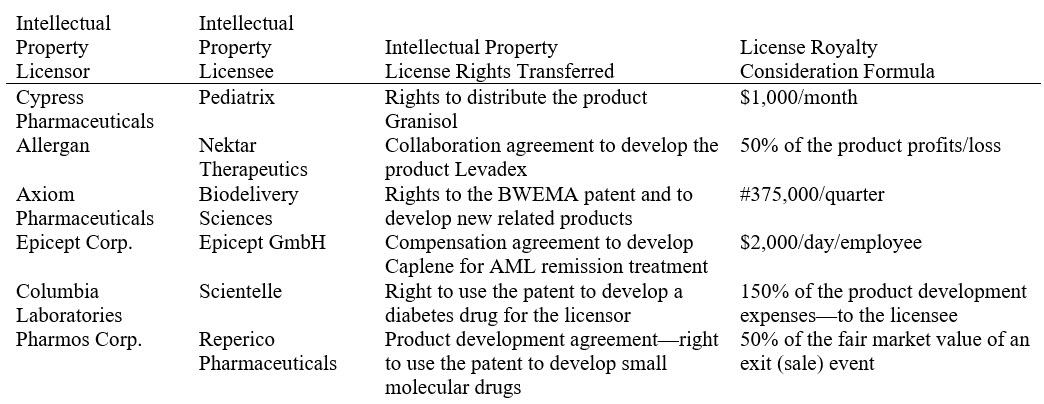
That is, the analyst was searching for intellectual property license agreements where the royalty rate was expressed as a percent of the licensee’s pharmaceutical product revenue.
Examples of the Quantitative Adjustment (Normalization) of Royalty Rate Noise
The analyst’s search produced numerous license agreements that had complex royalty compensation arrangements. With additional due diligence and research, the analyst could adjust the complex royalty arrangements to indicate an equivalent royalty rate expressed as a percent of licensee’s revenue. Exhibit 9 illustrates several of these quantitative adjustments that the analyst made to reduce the “noise” in the raw license agreement royalty rate data.
Exhibit 9: Alpha Pharmaceutical Company | Beta-Patent-Related Intellectual Property Valuation | Adjustment of Royalty Rate Observations
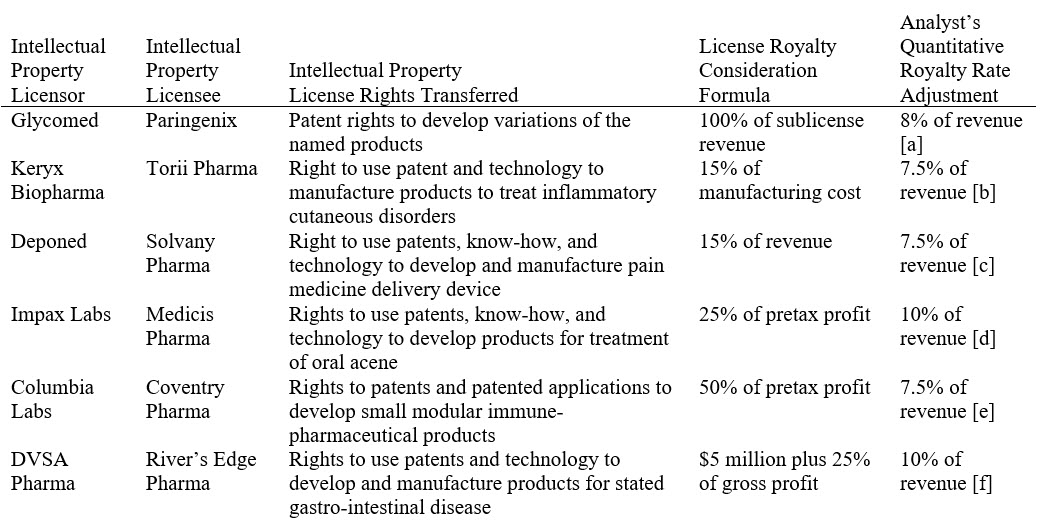
[a] Assumes that 100 percent of the sublicense revenue becomes pretax margin; 8 percent is the average pretax margin in this industry sector.
[b] Manufacturing cost equals about 50 percent of product revenue in this industry sector.
[c] As a rule of thumb, medical device licenses generally receive about twice the royalty rate as pharmaceutical product licenses.
[d] Gross profit margin is approximately equal to 40 percent of revenue in this industry sector.
[e] Pretax margin is approximately 15 percent of revenue in this industry sector.
[f] Gross profit margin is approximately 40 percent of revenue; the $5 million up-front payment settled a patent infringement lawsuit between the licensor and the licensee.
Examples of Qualitative Assessment (Normalization) of Royalty Rate Noise
The analyst noted that many of the license royalty consideration formula were expressed as a percent of the licensee’s product revenue. Some of these licenses were also complex agreements. The intellectual property license agreements were tied to manufacturing, joint venture, distribution, or other agreements.
In some of the agreements, a more fulsome bundle of assets was being licensed. In these cases, the analyst applied experience and judgment—as well as quantitative industry research—to qualitatively assess and adjust the license royalty rate arrangement. As illustrated in Exhibit 10, many of these assessments involve the analyst’s royalty rate conclusion that is “less than” or “more than” the CUT license agreement stated royalty rate.
Exhibit 10: Alpha Pharmaceutical Company | Beta-Patent-Related Intellectual Property Valuation | Assessment of Royalty Rate Observations
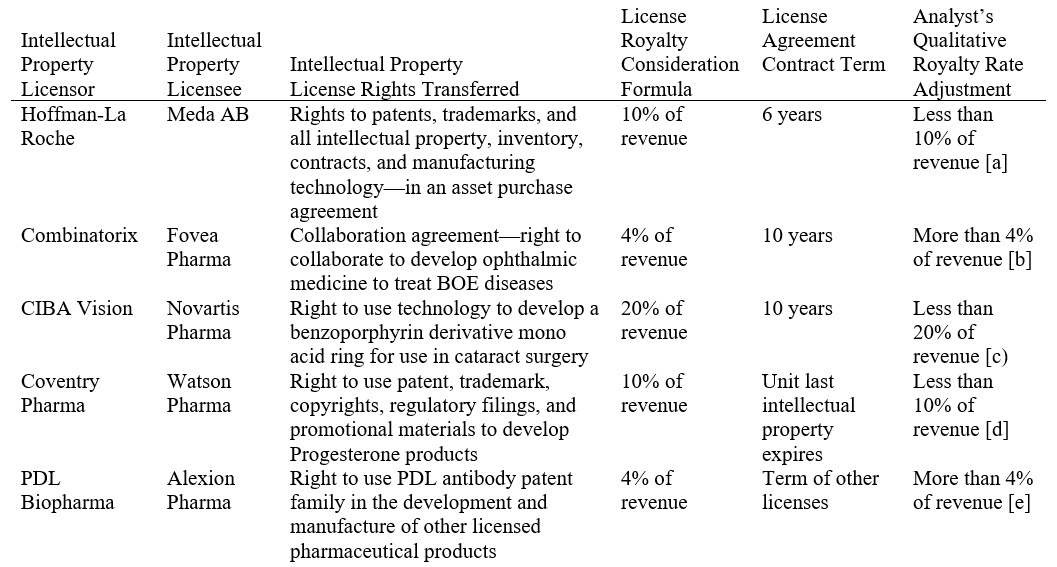
[a] The licensee is paying for the acquisition of a going-concern business.
[b] Both the licensor and the licensee have to contribute to the development of any new drug product.
[c] Medical devices typically receive higher royalty rates; this license also gives the licensee the right to buy materials from the licensor at cost.
[d] Includes multiple intellectual property assets and the right to operate a going-concern business.
[e] Patent can only be used with other licensed products; that contract arrangement also generates license royalty income to the licensor.
Selected CUT Royalty Rate Data for the Beta Intellectual Property Valuation
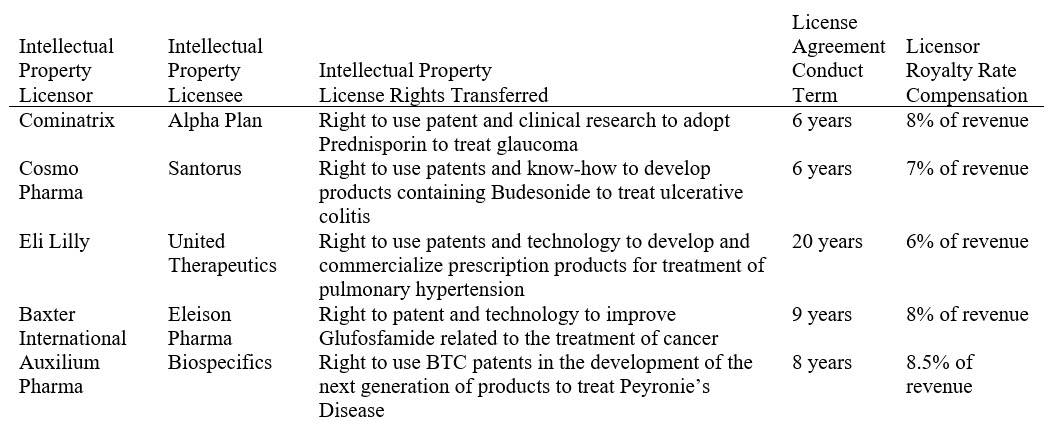
The analyst noted that some (although relatively few) of the potential CUT license agreements were, in fact, “Goldilocks” licenses. For the most part, these selected license agreements were “just right.” They provided particularly useful market-derived arm’s-length agreement royalty rate data that could be used to value Alpha’s intellectual property.
Exhibit 11 presents the CUT licenses that the analyst selected for use in the RFR valuation of the Beta patent, proprietary technology, and related know-how.
Exhibit 11: Alpha Pharmaceutical Company | Beta-Patent-Related Intellectual Property Valuation | Selected Royalty Rate Observations
Application of the Relief from Royalty Valuation Method
At this point in the analysis, the analyst has accessed intellectual property license databases, developed license agreement selection criteria, selected and reviewed 102 license agreements, and assembled (and normalized) empirical royalty rate data. Based on the assessment of the market-derived royalty rate data, the analyst has to answer the question: what is the appropriate market-derived royalty rate to use in the Beta patent-related intellectual property valuation? That is, what is the market-derived royalty rate for the valuation of Alpha’s intellectual property?
The purpose of this valuation is to quantify the intangible property exemption related to the unit property tax valuation of Alpha’s special purpose manufacturing facility in Taxem County.
As part of the RFR valuation, the analyst eliminated royalty rate data that did not present meaningful license royalty consideration. Then, the analyst adjusted the royalty rate data to indicate an adjusted range of royalty rates of 7.5 percent to 10 percent of licensee product revenue. This adjustment procedure produced the following royalty rate indications:
- Mean royalty rate—8.4 percent of revenue
- Median royalty rate—8 percent of revenue
- Mode royalty rate—7.5 percent of revenue
The analyst assessed royalty rate data that indicated a greater than/less than royalty rate range. Those data were the result of the analyst’s qualitative assessment of the royalty rate noise in the entire sample of intellectual property licenses. With regard to the Beta-related intellectual property, the greater than/less than range of royalty rates indicated the following:
- Royalty rate greater than 4 percent of revenue
- Royalty rate less than 20 percent of revenue
- Royalty rate odes—greater than 4 percent of revenue, less than 10 percent of revenue
Based on the most comparable of the sample of license agreements, the analyst selected CUT royalty rate data that indicated a range of 6 percent to 8.5 percent of revenue. These selected license agreements are sometimes referred to as “Goldilocks” agreements.
Based on the similarities of these selected licenses to the Beta-patent-related intellectual property, these individually selected agreements are “just right.” The final selection of CUT license agreements indicated the following royalty rate range:
- Royalty rate mean—7.5 percent of revenue
- Royalty rate median—8 percent of revenue
- Royalty rate mode—8 percent of revenue
Based on all of the above-described empirical royalty rate data, the analyst selected a royalty rate of 8 percent of revenue for use in the RFR method valuation of the Beta-related intellectual property. In addition to applying the selection criteria described above, the analyst considered the following factors in the final selection of the 8 percent of revenue royalty rate for the Beta-related intellectual property valuation:
- The relative profitability of the Beta product compared to the CUT patent products, including consideration of the relative profit margins of Beta versus the CUTs and the relative returns on investment of Beta versus the CUTs
- The relative total size of the Beta market compared to the market sizes of the CUT patent markets
- The relative growth rate of the Beta market compared to the growth rates of the CUT patent markets
- The relative position of the Beta product in its market compared to relative position of the CUT patent products in their respective markets
- The relative availability of substitutes for the Beta product compared to relative availability of substitutes for the CUT patent products
- The relative age of the Beta product in its life cycle compared to relative ages of the CUT patent products in their life cycles
The analyst recognized that, ideally, these comparative analyses are prepared on a patent-to-patent (or product-by-product) basis. However, based on data constraints, these comparative Beta/CUT intellectual property analyses may have to be developed on either:
- A company-to-company basis or
- An industry-to-industry basis.
Relief from Royalty Valuation Method Illustrative Example
Exhibit 12 presents the application of the RFR method to estimate the fair market value of the Beta patent-related intellectual property. This valuation is based on the market-derived intellectual property license analysis described above.
Exhibit 12: Alpha Pharmaceutical Company | Beta-Patent-Related Intellectual Property Valuation | Market Approach—Relief from Royalty Valuation Method | Fair Market Value | As of January 1, 2022 (in $ millions)
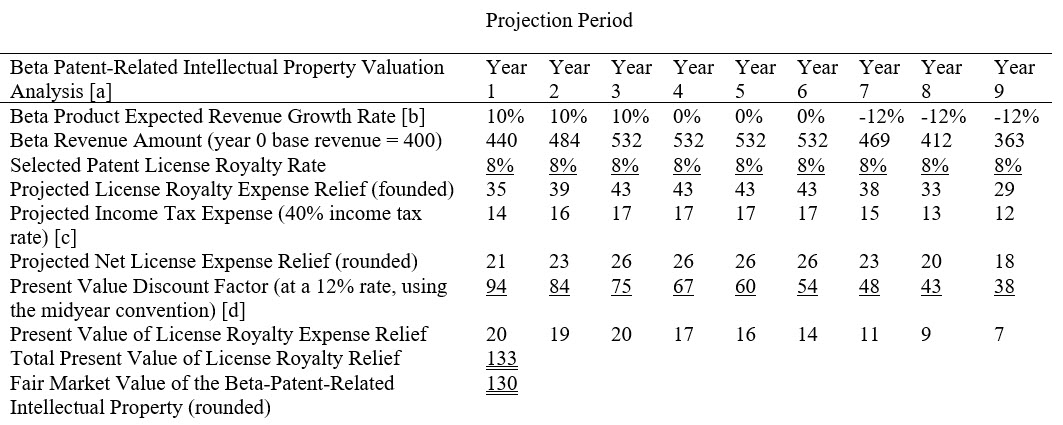
[a] The expected useful economic life (UEL) of the Beta product patent in 9 years; this UEL is based on Alpha management’s projection of the Beta product economic life. Alpha management is currently developing a replacement product. There are competitive pharmaceutical products that are beginning to enjoy market acceptance in competition to Beta.
[b] The analyst derived the projected revenue growth/decline rates (in conjunction with Alpha management) based on an analysis of similar drug product revenue growth/decline rates during the last half of their respective product patent life cycles.
[c] Assumes a 40 percent combined (federal and state) effective income tax rate, consistent with the income tax rate used in the property tax valuation of the Alpha manufacturing facility.
[d] Assumes a 12 percent after-tax present value discount rate, consistent with the after-tax weighted average cost of capital used in the unit principle property tax valuation of the Alpha manufacturing facility.
Relief from Royalty Method Valuation Summary
Alpha management retained the analyst to estimate the fair market value of the Beta intellectual property (i.e., the patent, proprietary technology, and related know-how trade secrets), as of January 1, 2022. The Alpha manufacturing facility was assessed by Taxem County based on a unit principle property valuation.
That unit principle property valuation included the value of all of the Alpha (1) working capital accounts, (2) real estate, (3) tangible personal property, and (4) intangible personal property. Alpha retained an analyst to prepare the valuation in order to claim an intangible property exemption with regard to the Taxem County assessment of the special purpose pharmaceutical manufacturing facility.
The analyst concluded that the market approach and the RFR method was most appropriate to value Alpha’s intellectual property. The analyst performed a comprehensive search—and a rigorous analysis—of CUT pharmaceutical product patent license agreements. Based on both quantitative and qualitative factors, the analyst selected a market-derived royalty rate to apply to the RFR method valuation.
Working with Alpha management, the analyst developed the other valuation variables needed to complete the RFR method valuation. Based on the results of the RFR valuation, and as summarized in Exhibit 12, the analyst concluded that the fair market value of the Beta-related intellectual property, as of January 1, 2022, was: $130 million. Alpha management used this intellectual property valuation to claim an intangible property exemption with regard to the $500 million assessment of Alpha’s special purpose manufacturing facility located in Taxem County.
Conclusion
This discussion presented an illustrative example of the application of the RFR method. The example focused on the analyst’s use of commercial license databases and the analyst’s procedures for adjusting the CUT license data.
The fifth and final installment of this series presents intellectual property analyst caveats. That final discussion also presents intellectual property valuation reporting guidelines.
Robert Reilly, CPA, ASA, ABV, CVA, CFF, CMA, is a Managing Director in the Chicago office of Willamette Management Associates, a Citizens company. His practice includes valuation analysis, damages analysis, and transfer price analysis.
Mr. Reilly has performed the following types of valuation and economic analyses: economic event analyses, merger and acquisition valuations, divestiture and spin-off valuations, solvency and insolvency analyses, fairness and adequacy opinions, reasonably equivalent value analyses, ESOP formation and adequate consideration analyses, private inurement/excess benefit/intermediate sanctions opinions, acquisition purchase accounting allocations, reasonableness of compensation analyses, restructuring and reorganization analyses, tangible property/intangible property intercompany transfer price analyses, and lost profits/reasonable royalty/cost to cure economic damages analyses.
Mr. Reilly has prepared these valuation and economic analyses for the following purposes: transaction pricing and structuring (merger, acquisition, liquidation, and divestiture); taxation planning and compliance (federal income, gift, estate, and generation-skipping tax; state and local property tax; transfer tax); financing securitization and collateralization; employee corporate ownership (ESOP employer stock transaction and compliance valuations); forensic analysis and dispute resolution; strategic planning and management information; bankruptcy and reorganization (recapitalization, reorganization, restructuring); financial accounting and public reporting; and regulatory compliance and corporate governance.
Mr. Reilly can be contacted at (773) 399-4318 or by e-mail to RFReilly@Willamette.com.


