
Capitalized Earnings: When are the Earnings Stabilized?
When you’re doing a business valuation, should you use a Capitalization of Earnings/Cash Flows? Or should you use a Discounted Earnings/Cash Flow method? Here’s a rule of thumb: If the benefit stream will be constant over time, choose the Capitalized Earnings/Cash Flows. Richard Claywell explains.
It is often easy to go directly to a Capitalization of Earnings/Cash Flows instead of using a Discounted Earnings/Cash Flow method when doing a business valuation. The Capitalized
Income method means that the application of one divisor (or multiple) to one economic income measure.1
The result is an indication of value derived from that single division or multiplication.
When using the Capitalized Earnings/Cash Flows, the assumption is that the benefit stream will be constant over time.2
When this method is applied in real valuations, I normally see the practitioner using either the average of the historical or the final year benefit stream. Using either of these two is probably acceptable as long as management believes that they represent the anticipated future benefit stream.
Let’s examine the historical benefit stream of a company. The following table represents the historical benefit stream of a company.
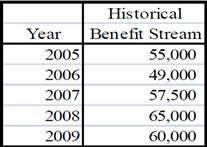
Looking at the table, the benefit stream ranges from $49,000 to $60,000.
This is a relatively small range for the benefit stream and appears to be fairly consistent over the valuation period.
Let’s take a look at some methods to consider when trying determining if the historical benefit stream may be stabilized and may represent the future anticipated benefit stream.
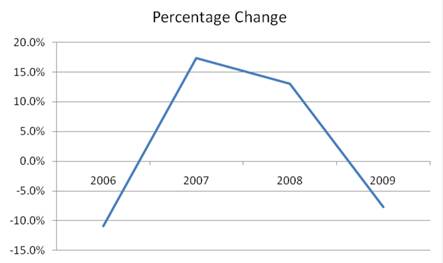
First, look at the percentage of change from year to year. The chart demonstrates that there are major changes in the benefit stream during the valuation period.
Next, look at a chart that shows the first year as a base year and a percentage of change based upon the first years benefit stream. This chart demonstrates that there is a series of peaks and valleys in the historical benefit stream.
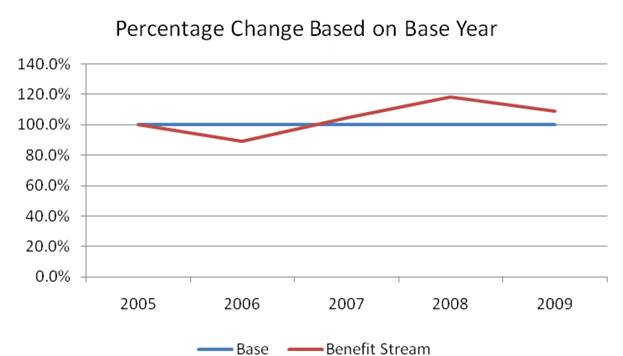
The valuator must now make a decision as to whether the historical benefit stream is representative of the anticipated future benefit stream. The answer will be based on professional judgment and experience. These two charts can assist in making that decision and help prevent the valuator from making an incorrect conclusion.
1 Pratt, Shannon P. “Valuing A Business: The Analysis and Appraisal of Closely Held Companies,” McGraw Hill, ©1998, Fifth Edition, p. 238.
2 Trugman, Gary R. “Understanding Business Valuations: A Practical Guide to Valuing Small to Medium-Size- Businesses,” AICPA, ©2002, Second Edition, p. 300.