When the usual approaches won’t work
Technology and innovation expert and professor, Tim Swift, proposes an alternative to the traditional Market, Income, and Cost approaches to valuing a patent portfolio.
 A 2001 study published by the Brookings Institution found that the composition of firm value changed dramatically at the end of the 20th century.1 In 1978, 80 percent of a firm’s market value was tied to its tangible assets. By 1998, only 20 percent of a firm’s market value was tied to the firm’s tangible assets. Eighty percent of the average firm’s market value is embedded in “intangible” assets—assets we can’t see or feel. Current estimates are mostly in line with 1998.
Patents held by the firm are often an important component of these intangible assets. Firms must account for this value on their balance sheets. This can be tricky. In recent litigation between Samsung and Apple, expert estimates of the value of Apple’s patents in question ranged from $38.4 million to $2.18 billion. Experts often must get creative when using data to support their valuation estimates. Under cross-examination, it was revealed that one expert’s evaluation incorporated reviews from customers, and that one of these customers claimed that the iPhone’s “Siri”, an information search application, shot him with a gun.2
Common approaches to valuing patents include the Cost Approach, Income Approach, and Market Approach. Under the Cost Approach, we assign a value to the patent based on what it would cost to replace that patent. The Income Approach requires the valuation expert to estimate the incremental cash flows or cost savings attributable to the patent and calculate the present value of that income stream. Under the Market Approach, the valuation expert estimates the value of the focal patent by observing the prices paid for similar patents that have been bought and sold recently.
All of these techniques assume that adequate data are available. As for the Cost Approach, we must know the current costs that the firm would incur to replace this patent. This is often difficult or impossible, because the innovation embedded in the focal patent is the only known way to perform a function. Similarly, the Income Approach requires that we can identify accurately the incremental economic impact the patent has on firm performance. The Market Approach assumes that there is an active market for similar patents—this is often not the case.
My scholarly research in technology and innovation management has revealed to me a new way to determine the value of patents when the usual approaches won’t work. One of the first things I learned that surprised me greatly during my doctoral studies is that most patents are useless and have no value. So how do we determine which patents have value?
In a 2005 paper in the RAND Journal of Economics, Hall, Jaffe, and Trajtenberg showed that the number of citations that a firm’s patents receive is statistically and economically significantly related to the firm’s market value.3 Citations to a firm’s patents drive firm value.
However, we can’t simply count up the citations to a firm’s patents and crank away. In a 2001 paper published by the National Bureau of Economic Research, these same authors showed that not all patents are created equal.4 Newer patents cite more patents than older patents did. In some industries, patents cite many more prior patents than in other industries. Therefore, in order to compare the number of citations received by patents in different industries, or created at different points in time, we must adjust those patent citations for temporal and industry differences.
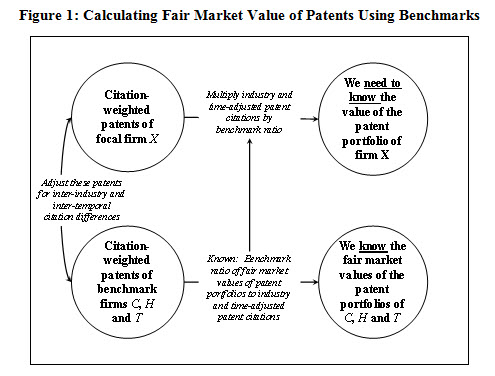
Let’s assume that we are required to determine the fair market value of the patent portfolio belonging to a hypothetical company X, which competes in the machine manufacturing industry (NAICS 333), and that the patents in this firm’s portfolio were granted in 2012.5 Data is not available to adequately estimate these patents using the traditional Cost, Income, or Market approaches. However, let’s consider a Modified Market Approach.
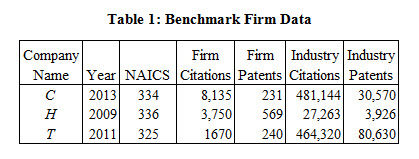
It is common for the valuation expert to be unable to locate patent sales that are directly comparable to the focal firm’s patent portfolio. It is often much easier to secure information on the value of patents held by other firms that are not directly comparable to the focal patents held by company X—in other words, patents from different industries, or granted in different years. Let’s assume we have patent and valuation data for three hypothetical firms: C, H, and T. C competes in the computer and electronic manufacturing industry (NAICS 334), H is in the automobile manufacturing industry (NAICS 336), and T competes in the pharmaceutical industry (NAICS 325). The traditional Market Approach would indicate that these data are not usable, because the patents with known values are from different industries, and the patents were granted in different years than those held by firm X. If we know the patent and citation counts of patents held by the benchmark firms, the values of the patent portfolios of these benchmark firms, and we know the U.S. Patent and Trademark Office (USPTO) patent numbers of the patents held by firm X, we can arrive at a valuation of firm X’s patent portfolio.
For the purposes of illustration, let’s use some hypothetical numbers. If we know the fair market value of the patent portfolios held by companies C, H, and T, and the USPTO numbers assigned to each patent granted to all four companies, we can determine the following information through research:
- The year in which each patent was granted
- The industry within which the patent was created
- The citations received by each patent
Using industry databases, we can also determine the total number of patents granted and the total citations to those patents in each industry for each year.
Table 1 is a summary of the data we need on the benchmark patents from firms C, H and T.
By comparing the number of citations the patents within each company’s patent portfolio has received to the average number of citations received by patents in the same industry in the same year, we can calculate an industry- and time-adjusted number of citations that each firm’s patent portfolio has received. We then can compare the number of citations received by each firm’s patent portfolio in a way that accounts for industry and temporal differences. As my co-author and I explained in a 2014 article in Strategic Management Journal,6 the measure of industry- and time-adjusted patented knowledge is measured as follows:
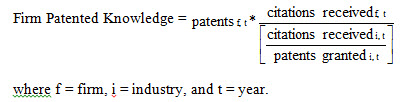
Table 2 shows how we calculate a measure of firm-level patented knowledge that adjusts each firm’s patents for the year in which they were granted, and the industry in which they were granted, so that all firm’s patented knowledge can be used for benchmarking. For each firm, we multiply the patents held by the firm (Column 2) by the citations those patents have received (Column 1), then multiply that product by the ratio of the number of citations that all patents in the firm’s industry, in the same year have received (Column 3) to the total number of patents granted in the firm’s industry, in the same year (Column 4). Note that the fair market values of the benchmark firm’s patent portfolios are presented in Column 7.
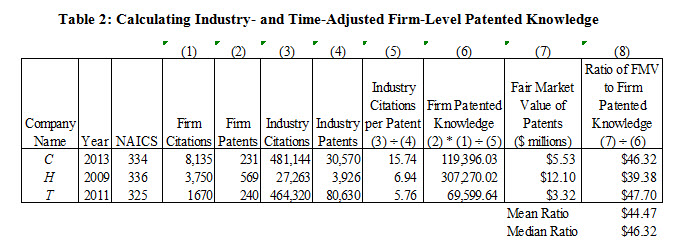
We can now observe the ratio of the fair market value of these benchmark patent portfolios (Column 7) to this new measure of firm patented knowledge, adjusted for industry and temporal differences (Column 6). These ratios are shown in Column 8. The mean ratio of the three benchmark firms is $44.47; the median ratio is $46.32. Since the mean is relatively close to the median, we can use the mean value in further analysis.
Now let’s look at some hypothetical data for firm X, whose patent portfolio we seek to value in Table 3. We calculate the firm’s patented knowledge, adjusted for industry and temporal differences, as firm patents (Row 1) times firm citations (Row 2) divided by industry citations per patent (Row 5).
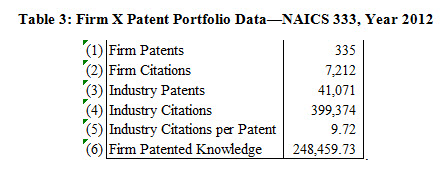
We can now multiply the measure of firm X’s patented knowledge (248,459.73) by the ratio of the fair market value to firm patented knowledge for our three benchmark firms ($44.47) to arrive at the estimated value of firm X’s patent portfolio:
248,459.73 * $44.47 = $11,047,918.
Using this new Modified Market Approach, the fair market value of firm X’s patent portfolio is estimated to be $11.05 million.
Note that we lacked adequate data to utilize the Cost or Income approaches to estimate the value of these patents held by firm X. In addition, we lacked data on the sales of patents from the same industry or the same years, so the Market Approach to valuing these patents also was not feasible. Using this Modified Market Approach, we arrive at a theoretically and empirically sound valuation of firm X’s patent portfolio.
Tim Swift, PhD, CVA, is an associate professor of strategic management, serving at St. Joseph’s University in Philadelphia, PA since 2008. He holds a PhD in strategic management, an MBA in financial management, and is a Certified Valuation Analyst (CVA). He has 14 years of senior management experience in the telecommunications and high-tech industries. He is also the proprietor of The Swift Group, LLC, a consulting firm that provides business valuation and strategic management consulting services. Dr. Swift’s research focuses on technology and innovation management. He has been published in the top academic journals in his field such as Strategic Management Journal and Research Policy. Mr. Swift can be contacted at (215) 499-7973 and also via e-mail at Prof.Tim.Swift@gmail.com.
1 Blair, M.M. and Wallman, S.H. Unseen Wealth (Washington: Brookings Institution Press, 2001).
2 Campbell, M. “Samsung expert says Apple patents worth $38.4M, not $2.2B,” Apple Insider, April 21, 2014, http://appleinsider.com/articles/14/04/21/samsung-expert-says-apple-patents-worth-384m-not-22b.
3Hall BH, Jaffe A, and Trajtenberg M. „Market value and patent citations,” RAND Journal of Economics 36, no. 1 (2005): 16-38.
4 Hall, B.H., Jaffe, A., and Trajtenberg M. “The NBER patent citations data file: Lessons, insights and methodological tools,” NBER Working Paper Series, (Cambridge: National Bureau of Economic Research, 2001)..
5 For simplicity, let’s assume all of the firms’ patents were granted in the same year. This methodology can be applied when firms are granted patents across many years, but its exposition becomes cumbersome.
6 Mudambi R, Swift T. “Knowing when to leap: Transitioning between exploitative and explorative R&D,” Strategic Management Journal, 35 (2014): 126-135.