Use of Pratt’s Stats Transactional Data
Issues and Opportunities
This article discusses some of the issues in using the Pratt’s Stats transaction data, which can be used to develop multiples in a Market Approach or to develop a private market discount rate used in an Income Approach. The information presented is relevant to both business brokers/intermediaries and business appraisers.
 This article discusses some of the issues in using the Pratt’s Stats transaction data, which can be used to develop multiples in a Market Approach or to develop a private market discount rate that can be used in an Income Approach. The information presented is relevant to both business brokers/intermediaries and business appraisers. All of the data used in this analysis is readily available, most from the Pratt’s Stats Private Deal Update, published by Business Valuation Resources. It is not intended to represent original research, but rather to illustrate some of the strengths and weaknesses of using transactional data.
A main principal in the valuation of small and mid-sized privately held companies is substitution, what alternatives are available to both the seller and the buyer. The seller can keep the interest, sell it, and invest the proceeds in another privately held company, or sell it and invest the proceeds in the public markets. The buyer can buy this business, buy another private business, or invest the intended purchase funds in the public markets. In my experience as a business broker, most of the sellers were exiting private ownership for retirement or other employment opportunities and were investing the funds from the sale in mutual funds. Most buyers were taking money out of public funds to buy the business; the alternative was to leave the money invested in the public markets and get another job. Therefore, the full range of alternatives to both the buyer and seller are investment in the public markets or investment in the private markets.
The Income Approach and the Market Approach are most often used in valuing operating businesses on a going-concern basis. I employ the Income Approach and the Market Approach from two different sources as surrogates that represent the range of alternatives available—public market data and private market data. This gives a broad reference set that covers the spectrum of alternative investments for the buyer and seller—they can buy a different company or put the money in the stock market. There are various methods that allow either private or public market data to be used either in an Income Approach or in a Market Approach. Traditionally, most appraisers used public company data in an Income Approach, and private market data in a Market Approach. An alternative Market Approach is to use guideline public companies; an alternative Income Approach is to use a discount/capitalization rate derived from private transaction data applied to an appropriate level of earnings.
Pratt’s Stats transaction data can be used to develop multiples used in a Market Approach or a private market discount rate used in an Income Approach. Regardless of the application, the appraiser needs to be aware of nuances in the data, so it can be applied correctly in either approach. When using any data source, it is important for the appraiser to understand the nature of that data. This is no less true for use of Pratt’s Stats. The web interface used to access the data presents a convenient summary and statistical analysis of the search results. However, the appraiser should not rely on these summaries, but rather download the entire data set. In the definitions and frequently asked questions provided by the publisher, users are instructed to examine the details of each transaction:
Why should I look at the details of each transaction in the Pratt’s Stats® database?
This is a good question and important one to ask because the MVIC prices do not indicate values for the same bundles of assets and liabilities for every transaction. Pratt’s Stats® reports deals as they occurred—which means that each deal can represent different groupings of assets (and liabilities, if working capital was acquired), from one to another. In order to use the data, you should look at the transaction report to see what transacted. You can discern this either by looking at the “Asset Data” in the top-middle of the transaction report, and if it says “Yes” to a purchase price allocation, then it indicates it is the allocation of the actual assets acquired in the transaction. Other times, if it is not listed there, then you can find it in the Additional Notes field of the transaction report towards the bottom. Further, an appraiser’s experience and knowledge about the transaction type and industry should assist in knowing what typically transacts in a given situation.1
What is Included in the Data
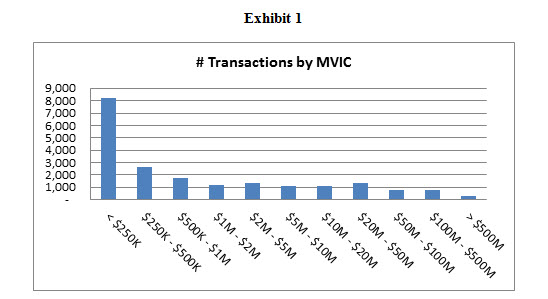
As of 2014, Pratt’s Stats had about 22,000 transactions completed by both public and private buyers, of which 14,939 are transactions with private buyers and includes both asset and stock transactions. Most of the data is provided by business brokers involved in the deal. However, about 30 percent are culled from SEC filings. Sales dates range from 1990 to the present, but it may take a year or more to collect transactions, so the few most recent years contain a smaller percentage of total transactions. Company revenues range from $0 (zero) to over $10 billion. However, the data is very heavily weighted with very small transactions, as shown in the following exhibit:
Forty percent of the total transactions are for companies that sold for less than $250,000, and 61.4 percent are for companies that sold for $1 million or less.
There are 111 data fields that provide a wealth of information for some of the transactions. Each field is defined and discussed in the definitions page on the Pratt’s Stats website. A few of these are mentioned here.
The sale price is defined as the market value of invested capital (MVIC). This includes the total consideration paid, including cash, notes, securities, long-term liabilities assumed, and any non-compete agreements. It does not include real estate, earnouts, or employment and consulting agreements. MVIC is usually considered to be equity plus interest-bearing debt, but be careful; for asset sales, it may or may not include all of the current assets. Cash, accounts receivable, and real estate are generally not included, but check the notes. Look at the “Asset Data” and “Additional Notes” sections to see if an asset allocation was provided that includes the assets sold and the agreed values between the buyer and seller. Stock sales include the entire entity; all assets and liabilities are included unless noted otherwise. It is a good idea to separate the stock sales from the asset sales in the analysis. Stock sales of small private companies may have very different prices than comparable asset sales due to differences in potential taxes and liabilities for both the buyer and seller.
When using earnings-based multiples, such as price-to-EBITDA, it is important to check if the reported statements have been adjusted. The “Restated Data” field indicates whether or not the income is adjusted to normalize earnings. While the data includes line items for “owner’s comp” and “yearly rent” that may or may not contain information, there are many other adjustments that brokers typically make that are not identified. Owner compensation, as well as other family salaries and expenses may be embedded in other line items. For example, I have seen numerous small businesses with part of the owners’ compensation allocated to cost of goods sold (because he or she also oversees the warehouse or production floor). It may also include non-working family member salaries. Furthermore, the information provided by brokers and accountants may not have been recast correctly. The information is generally not available for the appraiser to adjust the rent and owner’s compensation in the data properly. Many, if not most of the transactions do not include adjusted income. Beware; unadjusted statements can lead to artificially high earnings multiples.
Trends in the Data
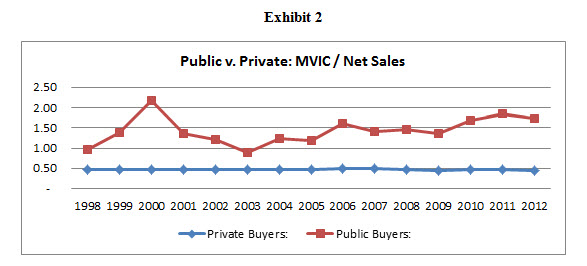
One of the widely accepted ideas is that the value multiples for small private companies do not vary significantly over time. Ray Miles, the founder of the IBA Market Database, did exhaustive studies in this area. However, it is always a good practice to check the data set being used to see if that is true for that data set or industry. The following exhibit shows the price-to-revenue multiples over time for the Pratt’s Stats data:
The chart shows that the price-to-revenue multiples for transactions involving a private buyer is fairly consistent over the past 15 years. However, the price-to-revenue multiples for transactions involving a public buyer are much higher and have varied significantly. This difference may be due to a wide variety of reasons, including the use of stock as a purchase medium or the relative size of the transactions. It is generally important to separate the data for private transactions from public. If the likely buyer, based on the nature of the subject company, is a private person, the appraiser may want to use just the private transaction data. If the most likely pool of prospective buyers is publicly traded companies, then the public data set may be most relevant. As always, the appraiser’s reasoned judgment is key.
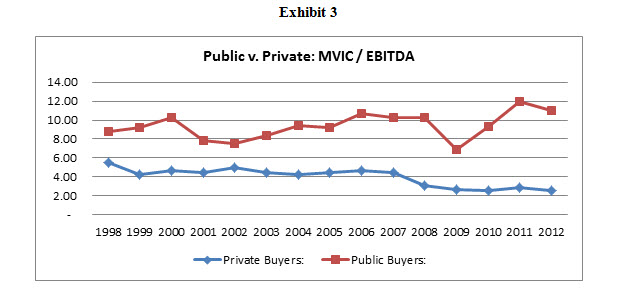
The following chart shows a similar analysis using the price-to-EBITDA ratio:
The chart shows that the price-to-EBITDA multiples for private buyers has varied somewhat, and for public buyers, is less volatile than the price-to-revenue multiples. The public buyer multiples are much higher than the private multiples are. The data shows a significant decline in price-to-EBITDA multiples for private buyers during the Great Recession of 2008 through 2012.
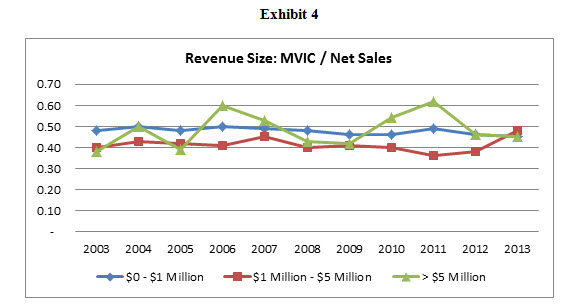
The data also shows variability over time by size of company. The following chart compares price to revenue for the transactions grouped into three size categories: $0 to $1 million revenue, $1 million to $5 million, and over $5 million:
The chart shows that the price to revenue multiples for smaller companies is less volatile than for larger companies.
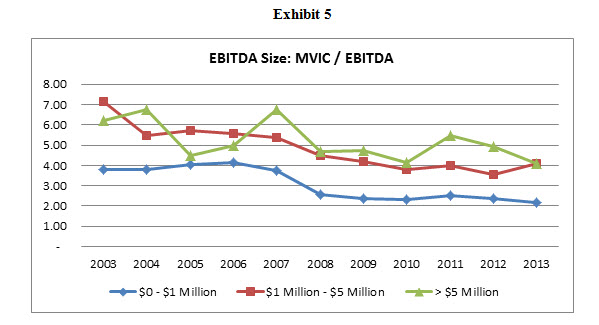
A similar analysis, using price-to-EBITDA, is in the following exhibit:
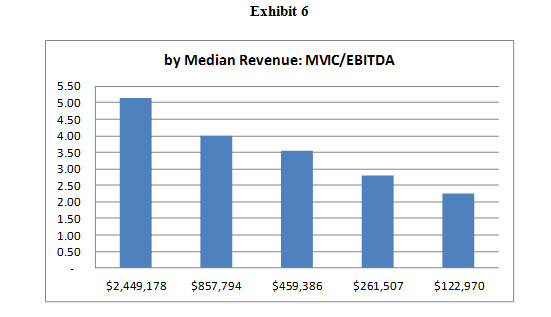
The preceding chart shows the importance of testing the data set over time. It also illustrates the importance of size. In general, smaller businesses, especially those under $1 million in revenue, sell for much lower earnings multiples. This is illustrated by an analysis completed by Zac Cartwright, which was published in an article titled “Median Valuation Multiples and Pratt’s Stats” in the Fourth Quarter 2013, IBBA Newsletter. The Pratt’s database of private transactions was sorted into quintiles (five groups with 2,776 transactions each). The median revenue for each quintile and the associated MVIC-to-EBITDA ratio is shown in the following chart:
The chart shows that as size, measured by revenue, decreases, so does the price to earnings multiple. The analysis shows that even within the less than $1 million revenue group, median price-to-earnings ratios change significantly with size. Therefore, appraisers should select transactions that are size comparable to the subject company.
Summary and Conclusions
The Pratt’s Stats transaction database provides much useful information. However, business appraisers should take the time to understand the data and use it with reasoned judgment.
Lou Pereira, CBA, MBA, CBI, ASA, CVA, is president of the Herold-Lambert Group, Inc., a mergers and acquisitions advisory firm, and a principal in Merrimack Business Appraisers, LLC, a business valuation firm. Merrimack Business Appraisers provides certified business valuations for transfer of ownership, estate planning, dispute resolution (Divorce & Partner Disputes), and tax matters.
Mr. Pereira earned a master of business administration degree from Babson College and has over 20 years of experience valuing, buying and selling business entities, including 12 years in corporate mergers and acquisitions and 10 years in private practice. He is a Certified Business Intermediary with the International Business Brokers Association, a Certified Business Appraiser with the Institute of Business Appraisers, and a Accredited Senior Appraiser with the American Society of Appraisers.
Mr. Pereira is also an adjunct professor at Fitchburg State University in Massachusetts and Southern New Hampshire University where he teaches degree-credited business courses in finance, including business valuation, and accounting. Lou can be contacted at (603) 890-6628 or Lou@MBAppraisers.com.
1 Source: Pratt’s Stats Definitions & FAQ (www.bvmarketdata.com).

