Internal Profiling for Fraud
How to Apply Survey Data to Your Company, using K-means Clustering
We are in an age when fraud statistics and the individual profiles of those committing the fraud are at an all-time high. How does a firm identify factors that will enable the firm to understand the risk? The Association of Certified Fraud Examiners (ACFE) annual fraud survey‚ÄĒreadily available for free‚ÄĒprovides valuable insight to prevent fraud. In this article, Elliott Chester shares how K-means clustering is developed and used for profiling employees.
 We are in an age when fraud statistics and the individual profiles of those committing the fraud are at an all-time high.  Each year, new academic and institutional research is added to this rolling accumulation of fraud data.  One of the most widely known and respected data sources used for fraud research, fraud prevention, and is the subject of my discussion today, is the Association of Certified Fraud Examiners (ACFE) annual fraud survey.  This survey is readily available and free, but how do we get all Minority Report on that data to use it to prevent future fraud?
The main epiphanies of the ACFE’s Report to the Nations are well known.  We know that white-collar fraudsters often do not have a criminal history.  They are well educated.  They have been with the company for a long time, and so on.  These learnings are priceless no doubt, but we cannot just take the quintessential fraudster profile from the ACFE report (or other reports for that matter), use it for every company, and only pursue individuals who fit that profile as investigative leads.  Rather, I propose what we can do is take the demographics and other fields used to depict the perpetrators in the survey and see how those relate to your company to identify areas with the right conditions for fraud.  Applying a k-means clustering model is a great way to do just that.  It breaks copious amounts of information into palatable chunks, and gives you a starting point when seeking potential fraud hot spots in your company.
Survey of K-Means Clustering Applications
There has been much written on the subject of k-means clustering as it relates to fraud, but it has overwhelmingly been applied to transaction data rather than employee data.¬† A thorough accounting of such works has been reported in a research paper by Professor Andrei Sorin at the College of Math and Computer Science in Pitesti, Romania.¬† In the report he cites 27 studies, spanning the years 2003‚Äď2011.¬† Of the 27 studies, only two apply k-means clustering to an actual person, but even those do not use employees.¬† Rather, they use customers of a business.¬† There are also other articles I found that are more recent, but they did not differ materially from the types referenced in Sorin‚Äôs study.¬† Thus, I think it is safe to assume that the application of k-means to employee demographics and attributes is a relatively new concept.
The limited application of k-means modeling to employees may partially be due to the sensitive nature of the public’s view on corporate monitoring and privacy.  However, according to privacy expert and attorney, Don Lloyd Cook from the Gill Law Firm in Little Rock, AR, employees in the U.S. have very few rights in investigations or audits.  Frequently, employee contracts will include provisions granting employers wide leeway in conducting internal investigations.  The employers or auditors are typically constrained only by their ability to legally access information.  Even though this is the reality, employees still cringe at the thought of their activity, much less their own personal attributes, being used against them.  Consequently, many organizations today take conservative positions on employee monitoring due to a fear of backlash, or they profile employees very discreetly and infrequently.
Methodology
Before I delve into the mechanics of k-means modeling, I first feel the need to convey that taking survey data and applying it to a larger population is indeed a worthy approach to employee profiling.¬† In fact, large companies whose primary business is data management do this to target potential customers and profit handsomely.¬† I know this because I used to do exactly that at one of these firms.¬† In short, we would either administer a survey or purchase a completed one from a third-party survey provider.¬† We would then match the survey respondents using Personally Identifiable Information or ‚ÄúPII‚ÄĚ to a massive database of U.S. citizens.¬† We then used the responses from the matches to project what other similar consumers‚Äô responses would be.¬† Hence, the concept is similar using the ACFE survey, but instead of using the actual survey respondents to match to a database, we are taking the respondent‚Äôs answers about demographics and matching them to company employee demographics.¬† The effect is the same.¬† Survey data becomes more than informational‚ÄĒit becomes versatile and powerful, if used correctly.
I am only going to explain one potential use of k-means clustering for employee profiling, although there are a myriad of approaches that could be taken.  The approach I will be covering is profiling employees at the business-unit level, such as the Accounting department or Human Resources team.  This analysis can be done all the way down to the individual level, but doing it by business units will be easier to demonstrate.
The basic methodology is to take company statistics and compare them to the survey results as a benchmark.¬† If the company is higher on a particular statistic than in the survey, then it could be said that the company would have a higher propensity for fraudulent activity with respect to that difference.¬† This explanation is oversimplified and obviously someone could not make this claim based on one statistic, but in general it conveys the idea.¬† As an example, let‚Äôs look at the age distribution of perpetrators as is shown in the ACFE survey.¬† The percent of cases with the age range of 41‚Äď45 years old, at 18.1%, is the highest of any other age range.¬† If we are comparing that percentage in the survey to that of the Accounting department of Company XYZ, and 25% of employees in that department are in the age group 41‚Äď45, then the Accounting department has a higher percentage on that particular statistic.¬† This becomes meaningful when multiple statistics are observed and applied to different parts of an organization.
In order to take these differences and apply k-means clustering, the data must first be prepped before it can be used.¬† It must be converted to a uniform scale to put it on the same playing field as all data points within the data set.¬† One method of doing that is by creating a relative index.¬† The following example will illustrate.¬† Let‚Äôs assume we are profiling business units, specifically the Procurement department of Company XYZ.¬† Using the ‚Äúposition of the perpetrator‚ÄĚ as the field, the survey reports that those classified as ‚ÄúEmployees‚ÄĚ are the highest at 46.5%.¬† Company XYZ‚Äôs Procurement department has 56.5% of personnel classified as Employees as opposed to ‚ÄúManagers‚ÄĚ or ‚ÄúExecutives‚ÄĚ.¬† By using the following formula we can convert this statistic into a relative measure, comparable to other fields in the survey:
56.5%  ÷  46.5%  x  100  =  121
In this way, we can state that Company XYZ‚Äôs Procurement department has 21% more ‚ÄúEmployees‚ÄĚ than the average reported in the survey.¬† Also, we can now take this index and use it with indices we create using other fields.¬† Then we can use them all as inputs in the k-means clustering model.¬† Leaving the fields as percentages would otherwise render the clustering model results useless, skewing results towards high percentage responses only.
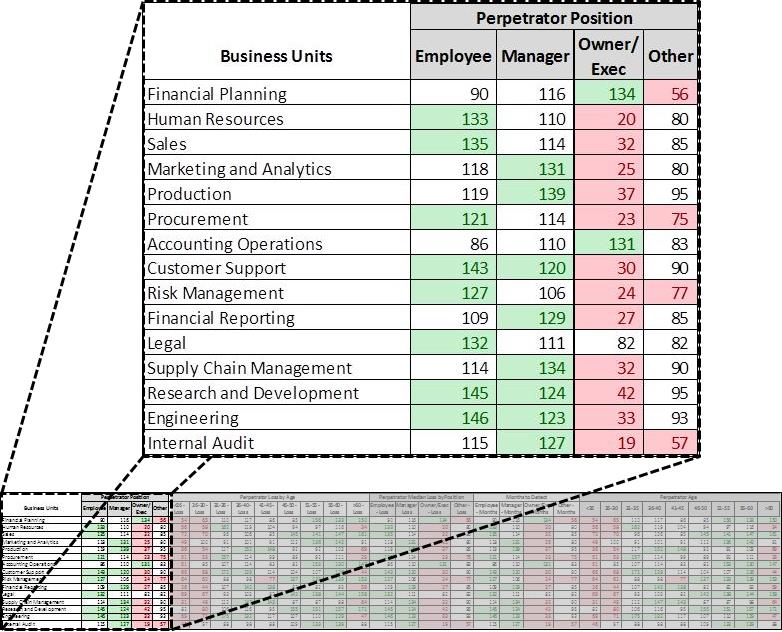
Continuing with Company XYZ as an example, assume we have computed indices for fifteen business units with ten fields.  Figure 1 shows an example of what that would look like.  For better visual distinction between numbers, those cells greater than 120 have been highlighted in green and those less than 80 in red.
Figure 1
            Green = >120 (significantly higher than the survey)
            Red= < 80 (significantly lower than the survey)
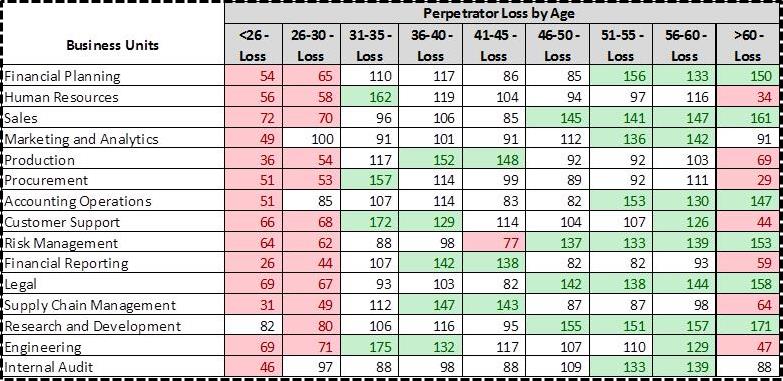
The above figure indicates there are more executives in the Financial Planning business unit of Company XYZ compared to the percentage listed in the survey (this is not saying there are more Executives than Employees, but rather there are more Executives than is reported in the survey).  Also, Figure 2 below indicates in the same business unit there are a greater number of older employees, who have a higher dollar loss than younger peers.
Figure 2
                 Green = >120 (significantly higher than the survey)
                 Red= < 80 (significantly lower than the survey)
The tables above can be interesting in and of themselves, but applying k-means clustering to this data helps convert them into a more manageable form.
Next I am going to walk you through applying the k-means clustering model now that the data is prepped.  There are several Excel add-ins out there you can use, but the best one I have come across is the XLMiner Pro Platform offered by Frontline Systems.  It does not require a direct connection to a SQL server, which can be a little difficult to setup.  XLMiner is as simple as downloading and enabling it in Excel’s Add-ins menu within Options.
Once the add-in is installed and enabled, you should see a new tab on the Excel ribbon as shown in Figure 3.  You will then select Cluster > K-Means Clustering.
Figure 3
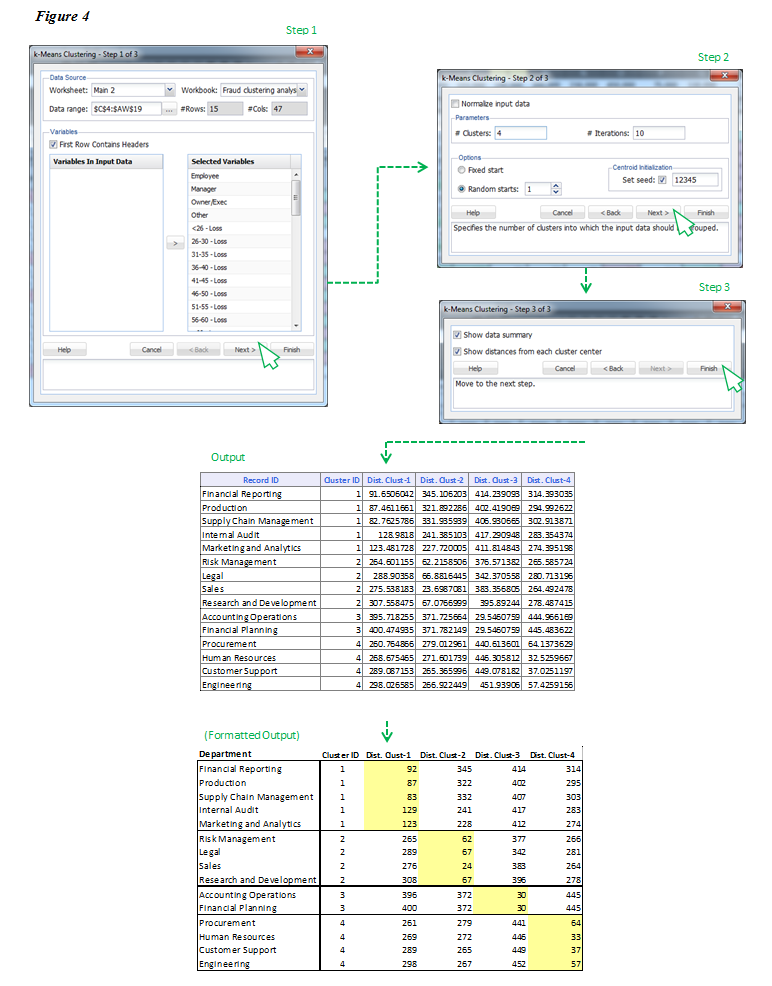
A window will open to guide you through the steps to execute the model.¬† In step one, as shown in Figure 4, select all records you want to use and include the row with headers.¬† Then add all variables you wish to use and click Next.¬† In step two, select ‚ÄėRandom starts‚Äô and input a number between five and 20.¬† Initially it does not really matter which number you pick because the model results will only output the number of clusters for which it has data to support.¬† In other words, if you select five but only four clusters are generated, that means there were not enough differentiating qualities in the data to create five clusters.¬† Next in step three, leave the two boxes selected and click Finish.¬† This will generate two tabs of output in your Excel workbook.¬† There is much to say about the first tab, but for brevity‚Äôs sake I will only discuss the second.¬† On the second tab you will see a table like that shown below labeled ‚ÄėOutput‚Äô with record ID, Cluster ID, and Distance to Cluster 1, Distance to Cluster 2, and so on.
Conceptually speaking, the clustering algorithm has selected ‚Äúcentroids‚ÄĚ or central numbers for each field, and then calculated the distance between that number and the Department‚Äôs index.¬† Each cluster only includes those Departments with the shortest distance from the centroid.¬† For example, if the center of cluster one is 100 and the Supply Chain Management department has the least distance (at 82.76), then it is included in cluster one.¬† This is repeated for each department and when the algorithm finds a department with a shorter distance to another center, it groups the department with that new cluster.A window will open to guide you through the steps to execute the model.¬† In step one, as shown in Figure 4, select all records you want to use and include the row with headers.¬† Then add all variables you wish to use and click Next.¬† In step two, select ‚ÄėRandom starts‚Äô and input a number between five and 20.¬† Initially it does not really matter which number you pick because the model results will only output the number of clusters for which it has data to support.¬† In other words, if you select five but only four clusters are generated, that means there were not enough differentiating qualities in the data to create five clusters.¬† Next in step three, leave the two boxes selected and click Finish.¬† This will generate two tabs of output in your Excel workbook.¬† There is much to say about the first tab, but for brevity‚Äôs sake I will only discuss the second.¬† On the second tab you will see a table like that shown below labeled ‚ÄėOutput‚Äô with record ID, Cluster ID, and Distance to Cluster 1, Distance to Cluster 2, and so on.
Figure 4
The formatted output in Figure 4 shows the results of the k-means clustering algorithm.  The cells highlighted in yellow represent the shortest distance from the cluster’s center for each department, which in turn, is the cluster to which each department is assigned.
Interpreting the Results and Taking Action
We have all of the departments grouped with other like departments, so it is time to begin profiling.  All clusters will share traits, but the key is to determine the set of factors that distinguishes each cluster from the others.  The best way to do that is by using the indices already created because they are relative measures of differences between clusters.
Using cluster one as an example, it has more ‚ÄúManagers‚ÄĚ than the other clusters.¬† There are more middle-aged employees and more males.¬† Cluster one is also highly educated, which carries more risk due to the fact that the median loss increases with education.¬† This cluster has more tenured people, with the majority having been with the company for one to five years and six to ten years.¬† Staff members of that tenure represent the most common of those who commit fraud, according to the survey.
Now that we have an idea of what this cluster looks like, we can use the information to tailor an assessment for potential fraud in cluster one.  Since there are more Managers who have a longer tenure, you might investigate things only Managers would be able to execute.  For instance, you could analyze the changes in the number and frequency of transactions with vendors.  You could also ensure vacations are being taken, check whether there have been any disputes between Managers and auditors, check to see if any Managers only deal with certain individuals within the company, or find out whether any Managers have refused promotions.
During this period of inquiry, all of the learnings should be retained and used to create standard profiles for normal job activity and department activity.  The profiles could then be compared to one another and any apparent anomalies vetted.  Also in future investigations, you will have these profiles as benchmarks to which you can compare to see if there are any discrepancies in the profiles.
Another response by the organization to the results of an employee profile could be more strategic or administrative in nature.  For instance, it may be decided that a particular business unit is too management laden.  In a move to strategically shift risk, the business unit could delay and remove or reorganize the management function.  Or, an organization might review a job role and decide it is too complex and in need of more transparency to provide more accountability, leading to a change in job descriptions to shift risk.
There are a multitude of ways employee profiling can be used by organizations.  At a minimum, high risk business units could at least have targeted awareness and training programs that focus on risks indicated by the profile.
Conclusion
The beauty of internal profiling is that it can be tailored to your organization’s definition of risk.  The facets of the ACFE’s Report to the Nations that I covered in this article only represent a handful of potential applications of the survey.  By following a similar methodology, you be the judge as to how you can make the survey data work for your organization.  While employee profiling will not give you a fraudster, it will provide you with the tools to identify employee attributes that have been present in fraud scenes all over the globe.
Elliott Chester, CPA, CFE, CVA, of Frost, PLLC’s Little Rock, AK office. Frost is a full service accounting firm with offices in Little Rock and Fayetteville, AK, Phoenix, AZ and Raleigh, NC. Since its founding, Frost has grown outside of its base in Little Rock; in 2003, Frost expanded to include an office in Fayetteville, Arkansas, then during 2007, Frost acquired a firm in Raleigh, North Carolina and in 2014, Frost merged with a firm in Phoenix, Arizona. Frost’s growth reflects its success at meeting and exceeding established objectives, as well as Frost’s national and international client base, some of which originated with its founder in 1974 and remain clients and friends over forty (40) years later.
Mr. Chester can be reached at: (501) 975-0107 or by e-mail: echester@frostpllc.com.


