IP Valuation—Beyond the Income and Cost Approach
Valuation analysts (“analysts”) are often asked to value debtor company intellectual property (IP) within a business bankruptcy context. Some of the bankruptcy reasons to value IP include the assessment of the following: the debtor’s solvency, a secured creditor’s collateral and protection, the fairness of a Section 363 IP asset sale or license, the debtor’s rejection of its IP licenses (and the implications of that rejection on the IP licensees) under Bankruptcy Code Section 365(n), and the reasonableness of a plan of reorganization. Many analysts immediately think of applying income approach or cost approach valuation methods to value the debtor company IP. However, if sufficient market-derived pricing data are available, market approach valuation methods can also be used to provide IP pricing guidance.
 Introduction
Valuation analysts (“analysts”) are often asked to value debtor company intellectual property (IP) within a business bankruptcy context. Some of the bankruptcy reasons to value IP include the assessment of the following: the debtor’s solvency, a secured creditor’s collateral and protection, the fairness of a Section 363 IP asset sale or license, the debtor’s rejection of its IP licenses (and the implications of that rejection on the IP licensees) under Bankruptcy Code Section 365(n), and the reasonableness of a plan of reorganization. Many analysts immediately think of applying income approach or cost approach valuation methods to value the debtor company IP. However, if sufficient market-derived pricing data are available, market approach valuation methods can also be used to provide IP pricing guidance.
First, this discussion summarizes the various types of IP that analysts may be asked to value within a bankruptcy context. Second, this discussion summarizes the generally accepted IP valuation approaches and methods. Finally, this discussion describes and illustrates a common market approach method for valuing debtor company IP. Analysts (and debtors, creditors, counsel, and other parties to the bankruptcy proceeding) should consider the application of market approach methods in the IP valuation.
IP Types
Bankruptcy Code Section 101 (35A) provides the following definition of IP:
(35A) The term “intellectual property” means:
(A) trade secret;
(B) invention, process, design, or plant protected under title 35;
(C) patent application;
(D) plant variety;
(E) work of authorship protected under title 17; or
(F) mask work protected under chapter 9 of title 17; to the extent protected by applicable nonbankruptcy law.
Outside of the bankruptcy context, trademarks and trade names are also considered to be common IP types. However, trademarks are not mentioned as part of the Bankruptcy Code definition of IP. Whether in a bankruptcy context or otherwise, these IP types are considered a subset of commercial intangible assets.
For bankruptcy purposes, the patent IP category is often expanded to include patent applications, the proprietary technology and product or process designs encompassed by the patent, and the engineering drawings, schematics and diagrams, and other technical documentation that relate to the patent or patent application.
The copyrights IP category is often expanded to include both registered and unregistered copyrights on publications, manuscripts, white papers, musical compositions, plays, manuals, films, computer source code, blueprints, technical drawings, and other forms of documentation.
And, the trade secrets IP category is often expanded to include any information or procedures that: (1) the debtor keeps secret, and (2) provides some economic benefit to the debtor. Trade secret IP may include: computer software source code, employee manuals and procedures, computer system user manuals and procedures, station or employee operating manuals and procedures, chemical formula, food and beverage recipes, product designs, engineering drawings and technical documentation, plant or process schematics, financial statements, employee files and records, customer files and records, vendor files and records, and contracts and agreements.
Valuation Approaches and Methods
All of the generally accepted intangible asset valuation approaches may be applicable to IP. The following table lists the generally accepted cost approach, market approach, and income approach IP valuation methods.
Table 1
Generally Accepted Intellectual Property Valuation Approaches and Methods
Cost approach methods:
- Reproduction cost new less depreciation method
- Replacement cost new less depreciation method
- Trended historical cost less depreciation method
Market approach methods:
- Relief from royalty method
- Comparable uncontrolled transactions method
- Comparable profit margin method
Income approach methods:
- Differential income (with/without) method
- Incremental income method
- Profit split method (or residual profit split method)
- Residual (excess) income method
Market approach methods are particularly applicable when there are a sufficient quantity of transactional data related to either comparable (almost identical to the subject) IP or guideline (similar from an investment risk and expected return perspective to the subject) IP. These IP transactions may relate to either sale or license transactions. Such arm’s-length, third-party IP transactions are typically called comparable uncontrolled transaction (CUT) sales or licenses. The analyst attempts to extract market-derived valuation pricing metrics (e.g., sale pricing multiples, license royalty rates, or income capitalization rates) from these CUT data in order to apply to the corresponding metrics of the debtor company financial fundamentals. Applying the market-derived pricing multiples or royalty rates to the debtor company fundamentals results in the market approach IP value indication.
In the relief from royalty (RFR) method, the analyst searches for arm’s-length IP licenses that may provide pricing guidance with regard to the subject IP. Typically, the analyst looks for a market-derived royalty rate that is expressed as a percentage (or multiple) of a common financial metric. A common IP royalty rate metric is a royalty rate expressed as a percent of the licensee’s revenue. In other words, in the arm’s-length license agreement, the use of the comparable IP is licensed from an independent licensor to an independent licensee for a license fee that is expressed as a percentage of the licensee’s revenue.
The analyst multiplies this market-derived royalty rate by the debtor company’s projected revenue in each period over the IP remaining useful life (RUL). The product of this multiplication is the royalty expense the debtor is relieved from paying because it owns (and does not need to inbound license) the subject IP. The present value of these “relieved” royalty payments is the RFR method IP value indication.
In the CUT method, the analyst searches for arm’s-length IP sales between independent parties. In other words, the analyst looks for the arm’s-length sale of a fee simple interest in the comparable IP from an independent seller to an independent buyer. In particular, the analyst looks for CUT sales data that can be expressed as a multiple of the number of IP units sold or as a multiple (or ratio) of the IP owner/operator’s revenue or income. Such pricing metrics could include dollars per number of patents in an IP portfolio, dollars per line of computer software source code, or dollars per number of engineering drawings or blueprints transferred.
Table 2 presents some of the automated data sources that analysts commonly reference in the search for guideline IP sale or license transactions. These automated databases provide complete copies of the IP sale or license documents. The analyst reviews these potential CUT transactions and selects the most comparable transactions to provide pricing guidance related to the debtor company IP. These databases are searchable by IP type, owner/operator SIC code, transaction date time period, country of transaction participants, and other search criteria. These on-line databases typically obtain their source documents from SEC-registered company (sale or license transaction participants) public filings.
Table 2
Common On-Line Databases for IP Sale or License Transaction Data
RoyaltySource
www.royaltysource.com—This AUS Consultants database provides IP license royalty rates and IP sale data. Source documents are available for download.
RoyaltyStat, LLC
www.royaltystat.com—RoyaltyStat is a subscription-based database of IP license royalty rates, IP license agreements, and IP sale data compiled from Securities and Exchange Commission documents.
Royalty Connection™
www.royaltyconnection.com—Royalty Connection provides online access to license royalty rate and other license information related to all types of technology, patents, trade secrets, and know-how IP.
ktMINE
www.bvmarketdata.com—ktMINE is an interactive database that provides direct access to IP license royalty rates, IP license agreements, and IP sale agreements. Source documents may be printed.
In the comparable profit margin (CPM) method, the analyst searches for publicly traded companies that are sufficiently comparable to the debtor company—except that the debtor company owns and operates the unique IP and the selected public companies own and operate generic (or no) IP. The CPM method is based on the premise that the subject IP provides a profit margin advantage for the debtor company compared to the selected guideline companies. This profit margin advantage is typically measured at the earnings before interest and taxes (EBIT) profit margin level. For example, let’s assume that the debtor company earns a twenty percent EBIT margin and that the selected guideline companies earn a fifteen percent median EBIT margin. According to the CPM method, the debtor’s five percent profit margin advantage could be assigned as a reasonable royalty rate for the subject IP.
That royalty rate (based on the incremental profit margin) is multiplied by the debtor company’s revenue to estimate a royalty income stream. The present value of the royalty income stream over the IP RUL is the CPM method IP value indication.
Table 3 provides a list of the common on-line data sources that analysts use to identify either industry average or comparable company profit margins. These comparable profit margins are then compared to the debtor’s profit margin in order to identify any IP-related excess profit margin.
Table 3
Common On-Line Data Sources for the Selection of CPM Data
FactSet Research Systems, Inc.—FactSet
Hoover’s, Inc.—Hoover’s Company Records
Mergent, Inc.—MergentOnline
Morningstar, Inc.—Morningstar Equity Research
Standard & Poor’s—Capital IQ
Thomson Reuters—Thomson ONE Analytics
Market Approach IP Valuation Illustrative Example
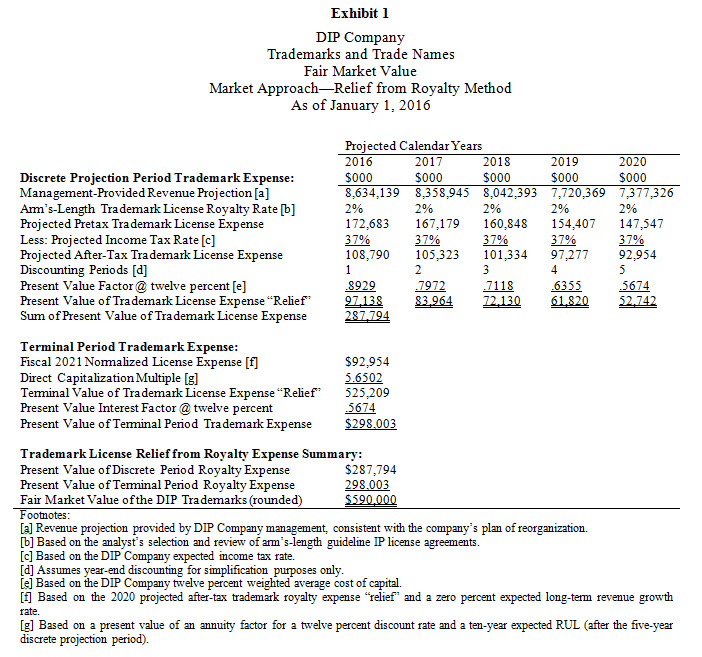
Let’s assume that DIP Company is seeking debtor in possession (DIP) financing. All of the debtor company’s tangible assets are already pledged as secured financing collateral. However, the lender will accept the debtor’s trademarks and trade names as collateral for the DIP financing. Before extending the DIP financing, the lender requires an independent valuation of the subject trademarks and trade names.
An analyst is retained to perform the IP collateral valuation as of January 1, 2016. The analyst selects the market approach and the RFR method. After analyzing several guideline IP license agreements, the analyst selects two percent of revenue as the appropriate market-derived IP license royalty rate. DIP Company management provided the analyst with a five-year revenue projection for the debtor company. Working with DIP Company management, the analyst selected: (1) a twelve percent present value discount rate (based on the debtor’s weighted average cost of capital), (2) a fifteen-year trademark total RUL, and (3) a zero percent expected long-term revenue growth rate beyond the discrete projection period.
The analyst’s market approach RFR method IP valuation is summarized in Exhibit 1.
Based on the illustrative fact set, the analyst concluded that the fair market value of the hypothetical DIP Company trademarks and trade names is $590 million.
Summary
Analysts may be called on to value a debtor company’s IP for a variety of bankruptcy-related reasons. Analysts (and other parties to the bankruptcy) initially think of applying income approach or cost approach valuation methods to value debtor IP. However, if there are sufficient market-derived sale or license transactional data available, the market approach can also provide meaningful pricing guidance with regard to the debtor IP. This discussion summarized the generally accepted market approach IP valuation methods. And, this discussion provided a simplified illustration of one market approach IP valuation method—the RFR method. Analysts (and other parties to the bankruptcy) should consider applying market approach methods in the bankruptcy-related IP valuation.
[divide]
Robert Reilly, CPA, ASA, ABV, CVA, CFF, CMA, CFA, is a managing director of Willamette Management Associates based in Chicago. His practice includes business valuation, forensic analysis, and financial opinion services. Throughout his notable career, Mr. Reilly has performed a diverse assortment of valuation and economic analyses for an array of varying purposes.
Mr. Reilly is a prolific writer and thought leader who can be reached at: (773) 399-4318, or e-mail to: rfreilly@willamette.com.