Exploring the Pluris® Restricted Stock Database and DLOM Calculator
A White Paper Detailing Use of the Pluris Database to Develop a DLOM (Part I of III)
Business valuation practitioners continue to debate the merits of different databases to develop a discount for lack of marketability (DLOM). In this first- of a three-part series, Marc Vianello discusses what the Pluris DLOM database is, explores how accurately Pluris transactions are reported, and discusses how the Pluris DLOM Database has been presented to the business valuation community.
Introduction
[su_pullquote align=”right”]Resources:
Pluris DLOM Valuation Advisors
20 Valuation Databases & Resources in 60 Minutes (Fasten Your Seatbelts!)
[/su_pullquote]
Debate continues over how valuation professionals should estimate discounts for lack of marketability (DLOM). Many practitioners benchmark their DLOM conclusions against restricted stock transactions, option-based models, and a host of other methods. This paper will consider the Pluris®. This paper studies the use of restricted stocks—specifically the Pluris DLOM Database™—as a benchmarking device for DLOM estimation.[1] Our analysis is based on Version 4.2.0 of the Pluris DLOM Database, which is dated November 21, 2014. All references to the Pluris DLOM Database used in this article are to that version.
Pluris states, “With this data your determination of an appropriate marketability discount for your valuation will be based on actual transaction data, not on an opinion, prior court cases, or a median value from a smaller study.”[2] This paper evaluates: 1) whether restricted stock transactional data is reliable for DLOM conclusions, and 2) the empirical justification that the Pluris DLOM Database provides for option-based measures of DLOM. To do so this paper explores: a) the restricted stock transactions that comprise the Pluris DLOM Database; b) how Pluris measures the discounts that it reports in the Pluris DLOM Database; c) the statistical distribution of the discounts reported in the database; d) how the discounts reported in the database relate to the financial metrics reported for the issuing companies; e) how the discounts reported in the database relate to changes in Rule 144 holding periods; and f) how the discounts reported in the database relate to relative price volatility.
Section I
What is the Pluris DLOM Database?
The Pluris DLOM Database is a listing of restricted stock private placement transactions that is updated quarterly.[3] The source of the reported transactions is the PrivateRaise database, which, according to its website, “is the leading source for comprehensive analysis of private investments in public equity (PIPEs), Reverse Mergers, Shelf Registrations, and Special Purpose Acquisition Companies (SPACs).”[4]
The Pluris DLOM Database obtained for analysis includes 3,632 restricted stock transactions from January 2, 2001, to June 30, 2014. The transactions include issuers whose stock is or was traded on the following exchanges: NASDAQ-Capital Market (CM), NASDAQ-Global Market (GM), NASDAQ-Global Select Market (GS), NYSE, NYSE Amex, Over-the-Counter (OTC), and OTC Bulletin Board (OTC BB).
Each transaction in the Pluris DLOM Database potentially contains 76 fields of data. Not every transaction reports complete data. The basic information provided for each transaction includes:
- Issuer name
- Ticker symbol
- The primary exchange for issuer’s securities
- Standard Industrial Classification (“SIC”) code
- Sector
- Issue date
- Gross proceeds
- Common stock discount or premium
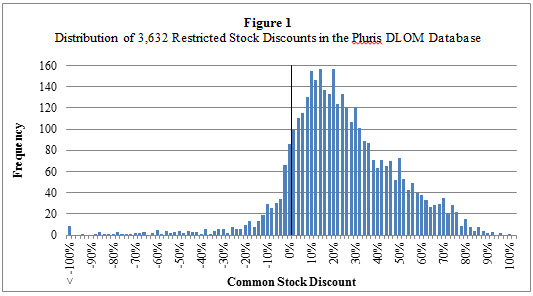
Pluris states, “[R]estricted shares of public companies are marketable…[and] can be sold in private transactions, at a discount.”[5] But what does the discount represent? Pluris and many practitioners simply assume that restricted stock discounts equate to DLOM, but if that assumption were accurate, then a discount would be reported for each of the 3,632 transactions in the database. Instead, 443 transactions occurred at sale prices equal to or above the publicly traded stock price. Those sold at prices higher than the corresponding public market price sold for price premiums, not price discounts.
The existence of restricted stocks sold at price premiums relative to the public market price is strong evidence that factors other than DLOM affect the prices reported for restricted stocks. Consequently, there may be no reasonable basis for benchmarking DLOM against a population or sub-population of restricted stock transactions. The uncertainty of composition of restricted stock discounts is exacerbated by problems measuring the discounts in some instances (e.g., when warrants are a part of the transaction) and by the lack of correlation of the observed discounts with any of the available financial metrics. We discuss these problems in detail later in this paper.
The restricted stock transactions that occurred at price premiums do not conform to the generally held view that marketability restrictions result in valuation discounts relative to fully liquid investments, and actually undermine the notion that restricted stocks are an appropriate benchmark for estimating DLOM. Setting that contradiction aside, including zero and negative discount transactions in DLOM estimation inappropriately shrinks the average discount. Restricted stocks sold with no discount or at a premium price (i.e., a negative discount) relative to the publicly traded price cannot represent DLOM and should be excluded from DLOM benchmarking exercises.
Importantly, the nature of the restriction(s) attached to each restricted stock listed in the Pluris database is not disclosed. This fact negates the ability to reach an informed conclusion about the extent to which the observed discount represents compensation for lack of marketability or compensation for something else. We are not aware of any evidence from Pluris or any other source that shows an association between restricted stock discounts and the difficulties of investors who want to sell such investments. Without establishing that connection, it is speculation that restricted stock discounts actually represent DLOM. The discount may simply represent price leverage possessed by a large provider of capital over an issuer who needs money, or any number of unknown causes besides a lack of marketability. Nevertheless, for the purpose of this paper we assume that restricted stock discounts may represent DLOM. For comparison purposes, we at times present analyses separately for all transactions in the Pluris DLOM Database and for those reporting discounts greater than zero.
We present the results of a number of analyses throughout this paper. Some of the analyses were performed on the entire population of transactions in the Pluris DLOM database, while other analyses are performed on transaction subsets because of data limitations shown in Table 1:
| Table 1 | |
| Population of restricted stock transactions in the Pluris DLOM Database | 3,632 |
| Transactions that did not sell at discounted prices | (443) |
| Transactions with discounts > zero | 3,189 |
| Population of restricted stock transactions in the Pluris DLOM Database | 3,632 |
| Transactions lacking at least one valuation parameter required by the Pluris DLOM Calculator | (51) |
| Transactions for which DLOM can be calculated using the Pluris methods | 3,581 |
Section II
Are the Pluris Transactions “Accurate”?
Before commencing our analysis of the Pluris DLOM Database and the related methodology for calculating DLOM, we felt that a test of the transactional data would be appropriate.
Data Collection
We tested the accuracy of the financial statement data for the 15 specifically-selected restricted stock transactions and found no errors. However, we inadvertently discovered a transaction for Southern First Bancshares, Inc. that is incorrectly reported in the database as 159,846 shares issued January 27, 2014, at the price of $13 per share. The company’s Form 8-K dated January 27, 2014, reports that the transaction was for 475,000 shares. Also, the SIC code is incorrectly reported as 1311, which is Crude Petroleum and Natural Gas, and the industry sector is incorrectly reported as “Energy: Oil & Gas.”
We also identified a variety of other problems in the database:
- Although the population of restricted stock transactions in our version of the database is comprised of 3,632 transactions, there are only 2,085 unique stock issuers. Frequent issuers consequently have a disproportionate influence on the Pluris DLOM conclusions.
- The medians calculated using the Pluris RSED Method 1 included with Version 4.2.0 were based on 3,450 transactions, instead of the entire population of 3,632 transactions. This resulted in 182 transactions being excluded from Pluris DLOM calculations.[6] We corrected this omission for our analyses.
- The “DownloadCalculations” tab of the Pluris DLOM Database takes data from the “Data” tab and calculates the quartile median for each of eight valuation parameters. When a transaction does not have a value for the parameter, the blanks are counted as zeros. This has the effect of miscalculating downwardly the medians of quartiles. For our analyses, we corrected the Pluris formula to exclude blank cells from the calculations of the median values. This ensures that blank cells have no impact on the DLOM calculations.
- When a transaction in the database has a value equal to the demarcation between two quartiles, the Pluris DLOM methodology places the transaction in both quartiles. For example, when a transaction has one million dollars of total revenue for the preceding 12 months, the Pluris methodology puts this transaction in both the third quartile (one million to nine million dollars) and the fourth quartile (zero to one million dollars). This has the obvious, but apparently minor, effect of double counting the transaction. We made no adjustment for this type of defect.
- Some transactions have different announcement and closing dates. For example, Solitario Exploration & Royalty Corp. (ticker: XPL) announced its transaction a week before the reported February 28, 2014, closing date.[7] The announcement caused an immediate spike in the price of Solitario’s common stock resulting in an increased discount—based on the closing date—reported in the Pluris DLOM Database. There is no apparent assurance that discounts measured in such circumstances are proper. We made no adjustment for this type of defect.
- Some restricted stock transactions require the issuer to register the stocks after the closing date or else penalties are applicable. For example, Derma Sciences, Inc. (ticker: DSCI) sold common stock on November 8, 2007. DSCI was required to file a registration statement no later than January 7, 2008, and to use its best effort to cause the registration statement to be declared effective no later than March 5, 2008. Failing to do so would subject DSCI to a penalty.[8] The Pluris DLOM Database does not seem to account for the effects of such obligations on the transaction pricing. It is reasonable to believe that observed discounts would be greater and observed premiums lesser but for such registration obligations. We made no adjustment for this type of defect.
We concluded that data collection for the Pluris DLOM DatabaseT is reasonably accurate. However, practitioners should verify the accuracy of the specific transactions underlying their DLOM conclusions, recalculate the discounts observed by Pluris, and make adjustments for the methodological and formula problems identified above.
Discount/Premium Measurement
The discounts and premiums in the Pluris DLOM Database represent the difference between the closing price of the corresponding publicly traded stock of the issuer and the calculated price per share of the restricted stock on the date of its issue. Figure 1 shows the distribution of the reported discounts for the 3,632 restricted stock transactions in Version 4.2.0 of the database. As can be readily seen, many of the reported discounts are zero or negative. Negative discounts (i.e., restricted stocks sold at premium prices) are inconsistent with DLOM concepts, and support the notion that the observations may not reflect true discounts for lack of marketability.
| Figure 1
Distribution of 3,632 Restricted Stock Discounts in the Pluris DLOM Database |
Unlike the transactions used in other restricted stock discount studies or databases, the Pluris DLOM Database includes transactions that have warrants attached to them.[9] Pluris estimates the fair market value of the warrants and removes that value from the gross proceeds of the transaction.[10] The intended result is the common stock portion of the transaction proceeds.[11] Instead of using Black-Scholes or other option models, Pluris uses its LiquiStat™ data to determine the value of restricted stock private placement transactions with warrants.[12] Pluris states that it is its opinion that Black-Scholes and other theoretical models overvalue warrants.[13]
Of the 3,632 transactions in the Pluris DLOM Database, 1,867 had warrants attached, representing 51% of the transactions in the database. Of the 3,189 transactions reporting discounts greater than zero, 1,760 (55%) had warrants attached. Table 2 shows that there is a material difference in average restricted stock discounts depending on whether warrants attach to the transactions.
| Table 2 | ||||||
| All Transactions | With Warrants | Without Warrants | ||||
| Restricted Stock Discount | Count | Average Discount | Count | Average Discount | Count | Average Discount |
| All transactions | 3,632 | 22.4% | 1,867 | 30.3% | 1,765 | 14.0% |
| Discounts > Zero | 3,189 | 28.4% | 1,760 | 33.6% | 1,429 | 22.0% |
The average discount for the 3,632 restricted stock transactions comprising the entire Pluris DLOM Database is 22.4%. Reducing the population to the 3,189 transactions with reported discounts that are greater than zero increased the average discount to 28.4%. Further investigation revealed that the reported discounts for transactions involving warrants are dramatically greater than for transactions without warrants. Looking only at the transactions with reported discounts greater than zero, we found that those with warrants reported an average discount of 33.6% compared to 22.0% for the transactions without warrants—53% more discount.
The dichotomy of warrant and warrantless transactions is an example of how other factors can affect the amount of the discount. For example, LiquiStat may overvalue the portion of the transaction value attributable to the warrants, thereby inflating the supposed restricted stock discount;[14] or transactions with warrants may represent riskier stocks or other factors that require greater compensation for the investor; or perhaps warrants should be considered valueless, which would decrease the supposed discount. Furthermore, the discrepancy in discounts between transactions with and without warrants may differ from industry-to-industry, time, and other factors. It would be prudent for practitioners to investigate the value of any warrants attached to restricted stock transactions before relying on them or the Pluris amounts. It is beyond the scope of this article to test values that Pluris assigned to warrants; we therefore take the reported Pluris discounts at face value for the analyses described in this paper.
Section III
How the Pluris DLOM Database is Presented to the Valuation Community
A June 5, 2010, presentation[15] by Pluris to the National Association of Certified Valuators and Analysts (NACVA) included several graphs (shown below) that suggest a strong association between the restricted stock discounts reported in the Pluris DLOM Database and certain underlying transactional metrics. Those metrics are total assets; market value-to-book value ratio; 12-month stock price volatility for the publicly traded stock; block size of the restricted stock as a percentage of shares outstanding; and block size (quarters to sell).[16] Pluris reached several conclusions regarding the association between the observed restricted stock discounts and the graphed metrics, but did not report any R-squares of correlation or other statistical measures for the graphed relationships.
The subsections below discuss the five metrics selected by Pluris based on the 3,632 transactions comprising the database that we purchased. We ran a series of regression analyses to test the correlations and the reliability of the conclusions, and present graphs of our findings. Our graphs differ visually from the Pluris graphs because the x axes of our graphs are decile groupings of the restricted stock transactions while the x axes of the Pluris graphs are a mix decile and quintile groupings. This means that the lowest and highest values shown on the x axes of the Pluris graphs are comprised of the lowest and highest 10% of size groupings, respectively, of the data in the database. Meanwhile, the five intermediate data points are comprised of 20% size-based groupings of the data. These mixed groupings have the visual effect of a more uniform stair-stepping of the data than exists at the level of individual transactions. Additionally, it seems that Pluris included the transactions of the 10% groupings in the 20% groupings, thereby double counting them.
- Data Groupings
The graphs that Pluris presented to NACVA rely on data groupings. That is, they group the underlying transactional data into deciles (10% of the population) and quintiles (20% of the population).
Reducing a population into fewer subgroups tends to artificially increase the correlation of the average values and the groupings. The most extreme example is reducing a population to two subgroups. This will always result in a 100% R-square of correlation.
To demonstrate the effect of grouping data into progressively fewer subgroups, we split the Pluris database into 20, 10, and five subgroups of the metrics presented by Pluris to NACVA in 2010. Regression analysis on these sub-groupings results in progressively higher R-squares of correlation for each of the five metrics as the number of sub-groupings decreased. See Table 3.
| Table 3 | ||||
| Linear R-Square[17] | ||||
| Dependent Variable | 20 Groups | 10 Groups | 5 Groups | |
| Block Size (% Outstanding) | 66.8% | 85.7% | 95.3% | |
| Block Size (Quarters to Sell) | 31.5% | 42.0% | 70.8% | |
| Total Assets | 17.9% | 33.5% | 53.0% | |
| Balance Sheet Strength | 50.4% | 56.9% | 68.6% | |
| Price Volatility | 46.5% | 58.4% | 75.0% | |
Grouping thousands of transactions into a small number of subgroups can materially distort analyses. The extent of statistical distortion caused by grouping the Pluris restricted stock data is demonstrated by comparing the decile-based regression results reported by Figures 2 through 6 with the regression results of the underlying Pluris transactional data. Table 4 makes this comparison using linear regression:[18]
| Table 4 | |||
| R-Squares of Correlation of Pluris Restricted Stocks
3,189 Transactions with Discounts Greater than Zero |
|||
| Dependent Variable | With Decile Groupings | Without Grouping | |
| Block Size (Percentage Outstanding) | Figure 2 | 85.7% | 3.9% |
| Block Size (Quarters to Sell) | Figure 3 | 42.0% | 0.4% |
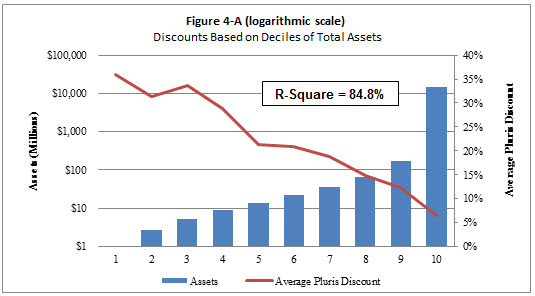
| Total Assets | Figure 4-A | 84.8% | 0.1% |
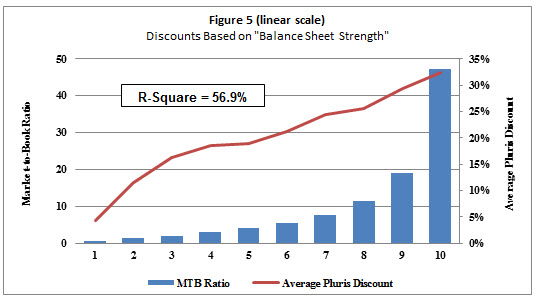
| Market Value-to-Book Value Ratio | Figure 5 | 56.9% | 8.7% |
| Price Volatility over Preceding 12 Months | Figure 6 | 58.4% | 12.4% |
Contrary to the graphs that Pluris presented to NACVA, the observed discounts have little correlation with the underlying transactional data. Price volatility provides the strongest R-square of correlation with the observed discounts, but it too is very weak. Our analyses below use decile groupings to facilitate comparison with the Pluris graphs.
- Discounts and Block Size
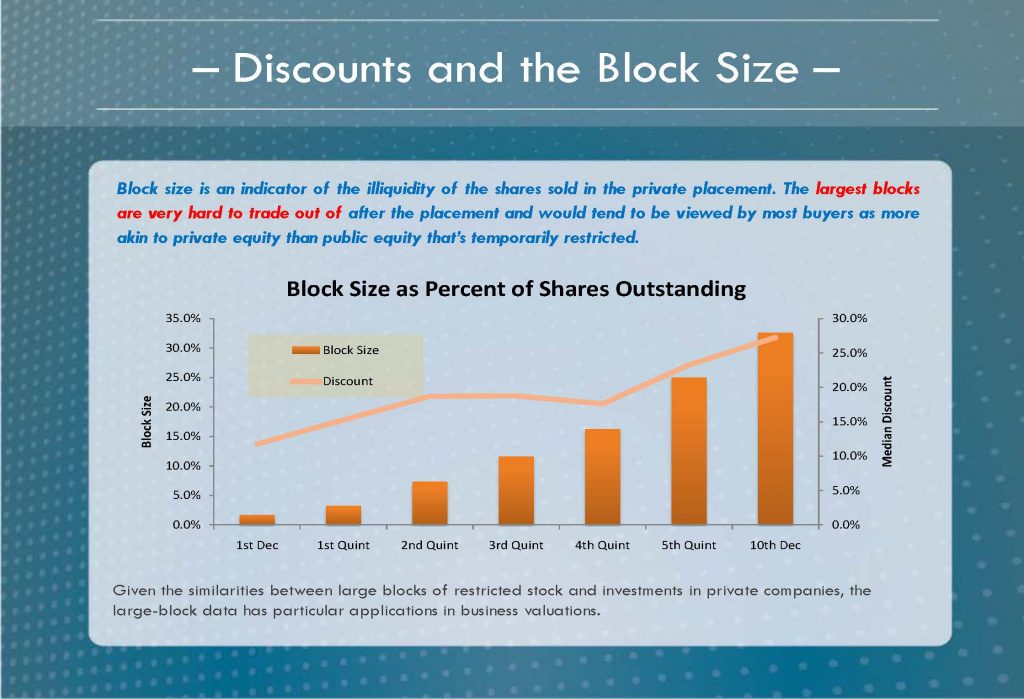
Pluris concluded, “Block size is an indicator of the illiquidity of the shares sold in the private placement. The largest blocks are very hard to trade out of after the placement and would tend to be viewed by most buyers as more akin to private equity than public equity that’s temporarily restricted.”[19] Pluris did not provide a basis for the assertions in the second sentence; we test the first sentence below.
 Source: http://www.pluris.com/files/PDFs/Pluris_DLOM_Database_Demo.pdf Source: http://www.pluris.com/files/PDFs/Pluris_DLOM_Database_Demo.pdf |
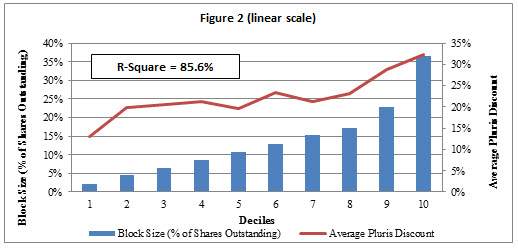
The Pluris graph is a mix of decile and quintile groupings of the transactions in the Pluris DLOM Database. Based on decile groupings, we calculated that the discounts reported in the database have a strong 85.6% linear R-square of correlation with block size stated as a percentage of shares outstanding based on the decile groupings.[20] See Figure 2. But as a block size increases relative to shares outstanding, one would expect that the investor gains negotiating power. Thus, it may be that the larger discounts associated with larger block sizes reflect increasing compensation due to buyer negotiating strength instead of increasing DLOM to compensate for illiquidity.
The positive association between block size and restricted stock discount is somewhat illogical. Considering that the companies comprising the Pluris DLOM Database are publicly traded, one could reasonably conclude that corporate control increases as the percentage of outstanding shares represented by the block size increases. On that basis, the relationship of observed discounts to block size should be negative, not positive.
The tested version of the Pluris DLOM Database includes 517 transactions with stock discounts of 50% or greater for which the average percentage block size is just 18% of shares outstanding. Based on the Pluris graph above and Figure 2, the discount for blocks representing 18% of shares outstanding should be under 25% not over 50%. In other words, larger blocks of stock may tend to be associated with larger stock price discounts, but larger discounts may not be associated with larger blocks. This inconsistency places some question on the conclusion that discount and block size are directly related, despite the high R-square of correlation shown in Figure 2.
Although there is a strong correlation of discounts and percentage block size when the transactions are grouped in deciles, the association falls apart when analyzed without grouping. We analyze the transactions without grouping them in Section V (Part II) of this paper.
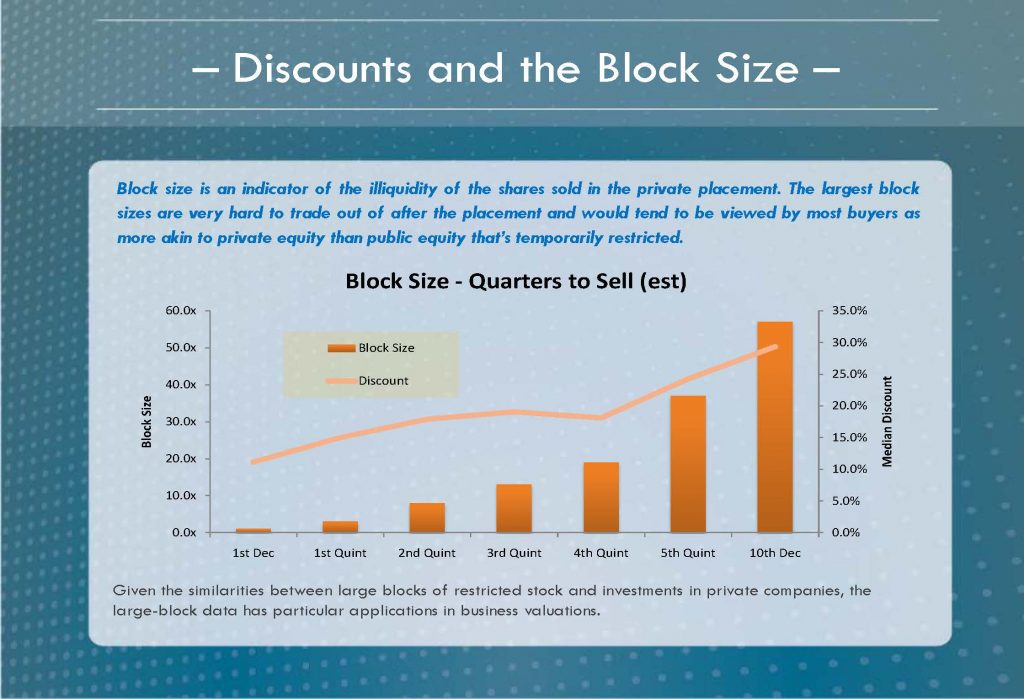 Source: http://www.pluris.com/files/PDFs/Pluris_DLOM_Database_Demo.pdf Source: http://www.pluris.com/files/PDFs/Pluris_DLOM_Database_Demo.pdf |
Pluris presented the above graph of restricted stocks purporting to show that “Block Size – Quarters to Sell” is an indicator of illiquidity. This parameter is a measure of the length of time needed to liquidate a block of stock under the “dribble out” provision of SEC Rule 144. Pluris again employed a mix of decile and quintile groupings of the transactions, which we consider inappropriate.
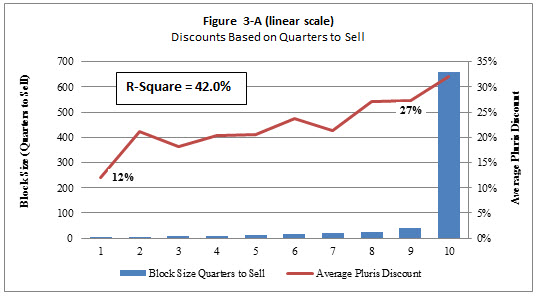
It is apparent from comparing Figure 3 to this Pluris graph that the 10th decile data sets must be materially different. The Pluris graph reports less than 60 calendar quarters (15 years) on average needed to sell 10th decile stock blocks, while Figure 3 reports an average of about 660 calendar quarters (165 years). The difference suggests that Pluris either removed a substantial number of long liquidation transactions from its analysis, or that the later database used in our analyses includes many more very large block transactions. Either situation undermines the reliability of the positive association claimed by Pluris.
Basing DLOM conclusions on the SEC Rule 144 restrictions ignores that a sale of the entire block could be made in a private transaction in a potentially much shorter period of time. It is, therefore, our opinion that basing DLOM conclusions on SEC Rule 144 dribble out time periods is not appropriate for blocks of restricted stocks that will require long time periods for selling into the public markets absent some provision that prohibits or limits sale of the block in non-public transactions.
Figure 3-A discloses the perception issue associated with the Pluris practice of mixing decile and quintile groupings of the database transactions. While the first decile represents transactions that would take an average of about two calendar quarters to be dribbled into the public market with a reported average discount of about 12%, the ninth decile represents transactions that would take an average of about 40 calendar quarters (10 years) to dribble out—20 times as long—but with a reported average discount of just 27%. Meanwhile, the 10th decile represents transactions that would take an average of about 660 calendar quarters (165 years)—another 16.5 times as long—but reports an average discount of just 32%.
The discounts associated with the transactions with much longer purported periods of illiquidity seem illogically low. An asset that cannot be sold for years should have a 100% DLOM at some point. The fact that the average discount of the ninth and 10th decile transactions is not 100% is an indication that the discounts do not exclusively reflect illiquidity, if they do at all.
Referring to Exhibit 3-A, we found that omitting the 10th decile of transactions from the analysis raises the linear R-square of correlation between discounts and quarters to sell from 42.0% to 68.1%.
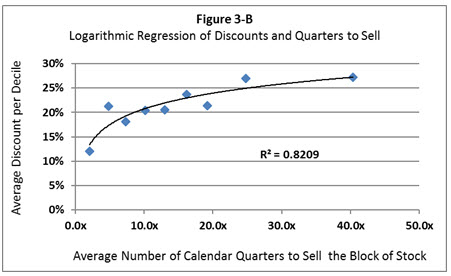
We found that the correlation of discounts and selling time improves dramatically to 82.1% if logarithmic regression is used to compare the average discounts of the deciles and the average quarters-to-sell of the first nine deciles. See Figure 3-B. Including the 10th decile in the logarithmic analysis did not significantly change the R-square. The reliability of results across deciles of transactions adds credibility to the idea that selling time affects the discounts. Nevertheless, the association falls apart when analyzed without grouping, which we do in Section V (Part II) of this paper.
Analysis of the “percent of shares outstanding” and “quarters-to-sell” data on a decile basis seems to support the conclusion that “block size is an indicator of the illiquidity of the shares sold in the private placement,” although the time-based dependency seems more logical. Nevertheless, even “quarters-to-sell” under Rule 144 says nothing about the time required to sell individual blocks of stock in private transactions outside of those rules. Thus, the increasing discounts associated with increasing block sizes could easily be attributable to additional or alternative causes than block size. Possible explanations of the discounts may be investor negotiating strength, issuer compulsion, other forms of compensation granted by the issuer to the investor, the industry of the issuer, or other factors. Practitioners would be right to question the reasonableness of basing discount and DLOM conclusions on the percentage of shares outstanding that is represented by a block of stock and SEC Rule 144 time periods.
Despite that time appears to be a factor in determining discounts, the Pluris methodology for calculating DLOM does not use block size in any form as a calculation parameter. Consequently, the Pluris “block size” graphs do not appear to add credibility to DLOMs calculated using the Pluris methodology.
- Firm Size Comparisons
Pluris concluded, “Size is a clear indicator of riskiness and investment attractiveness. Smaller companies require significantly deeper discounts as a result.”[21]
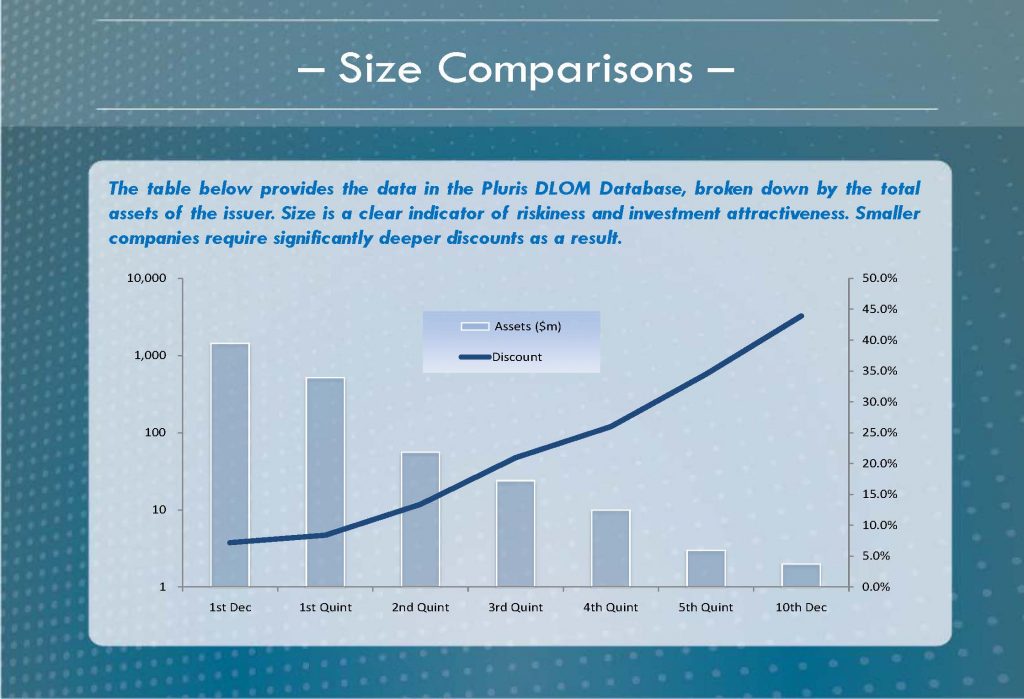 Source: http://www.pluris.com/files/PDFs/Pluris_DLOM_Database_Demo.pdf Source: http://www.pluris.com/files/PDFs/Pluris_DLOM_Database_Demo.pdf |
The Pluris graph uses a logarithmic scale for its left-side y-axis, a linear scale for its right-side y-axis and a mix of decile and quintile groupings for its x-axis. Figure 4-A presents the Pluris database divided into 10 equal segments based on the companies’ total assets. Note that we reversed the direction of the x-axis relative to the graphic presentation by Pluris so that asset size increases as the scale moves from left to right. This change likewise reversed the trend of the observed discounts so that the slope decreases from left to right. These effects are purely visual and were made to make the asset presentation consistent with the smallest-to-largest x-axis presentations of the other Pluris graphs.
We calculated that the observed discounts reported in the database have a strong 84.8% R-square of correlation with the 10 size groupings of issuers’ total assets when measured logarithmically. See Figure 4-A below. The reported value of total assets seems to account for the preponderance of the variation in the observed discounts. This fact tentatively supports using total assets to predict discounts.
Another difference from the Pluris “Total Assets” graph is visible in Figure 4-A. The Pluris graph reports a multi-million dollar positive number for the smallest asset grouping (10th decile in the Pluris graph). However, Figure 4-A shows that the smallest asset size in the database actually averages to a negative number. This suggests that Pluris removed the negative asset companies from its presentation, which of course has an effect on perceptions.
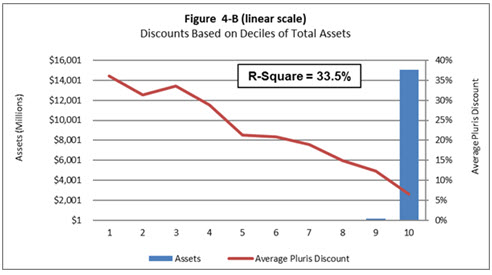
The use of logarithmic scale for the left-side y-axis of the Pluris “Total Assets” graph is noteworthy. There are times when logarithmic presentation is appropriate, but in this case it hides (as does mixing decile and quintile size groupings of the data) the dramatic difference in size between the decile with the largest asset values and the other decile groups. Moreover, the decile group with the most assets presumably is redundantly part of the top quintile grouping, thereby affecting the stair-stepping appearance of the y-axis and potentially affecting one’s acceptance of total assets as a predictor of DLOM. Figure 4-B shows the Figure 4-A data using a linear scale for the left-side y-axis.
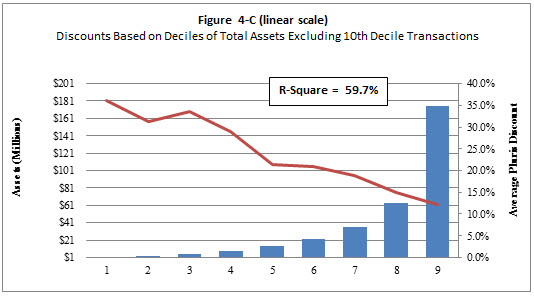
The presentation of the data and the linear R-square of correlation improve if the 10th decile transactions are omitted from the analysis as shown by Figure 4-C. These nine deciles of transactions show a 59.7% R-square of correlation with discounts. However, as previously stated, reliability requires correlations to be reasonably consistent across the full body of data that includes the 10th decile, so we reject this analysis.
Logarithmic analysis of discounts on a decile basis seems to support the conclusion that “size is a clear indicator of riskiness and investment attractiveness. Smaller companies require significantly deeper discounts as a result.” However, we show in a subsequent Part of this paper that the indicated association with total assets is not statistically significant when studied at the transaction level of detail.
- Balance Sheet Strength
Pluris concluded, “Balance sheet strength is a clear indicator of riskiness and investment attractiveness. Issuers with weaker balance sheets require significantly deeper discounts.”[22]
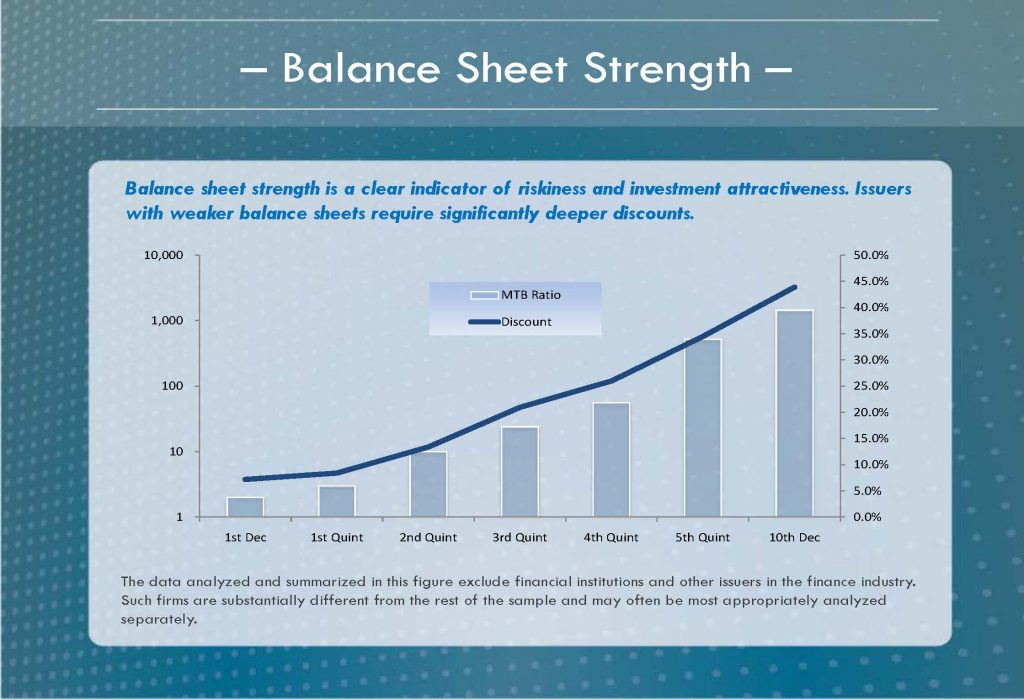 Source: http://www.pluris.com/files/PDFs/Pluris_DLOM_Database_Demo.pdf Source: http://www.pluris.com/files/PDFs/Pluris_DLOM_Database_Demo.pdf |
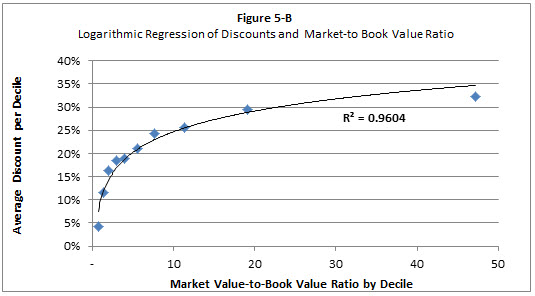
Pluris associates the ratio of market value-to-book value with balance sheet strength, and assumes that higher multiples are a sign of financial weakness. Both appear to be incorrect. Market value-to-book value ratios measure investors’ expectations regarding the effectiveness with which a business can generate profits from its assets. Higher ratios are therefore an indication of higher performance expectations (financial growth) that come from stronger business plans, stronger asset bases, stronger market positions, stronger management, and/or other strength factors. But the ratios say nothing about the relative balance sheet strength of enterprises. Nevertheless, market value-to-book value ratios appear to be a predictor of the restricted stock discounts reported in the Pluris DLOM Database. We calculated an R-square of correlation of 56.9% using this parameter. See Figure 5.
As with the Pluris “Size Comparisons” graph, the “Balance Sheet Strength” graph uses a logarithmic scale for the y-axis and a mixing of decile and quintile data groupings for the x-axis. These visual techniques have the effect of stair-stepping the x-axis to make it more persuasive. Figure 5 eliminates misperception by presenting decile groupings and a linear scale for the y-axis.
Although it seems intuitive that “balance sheet strength is a clear indicator of riskiness and investment attractiveness,” and that “issuers with weaker balance sheets require significantly deeper discounts,” can it be said that the data on which Pluris relied “clearly” support those conclusions? A 56.9% R-square of correlation leaves a lot of noise unaccounted for. To get a better answer to the question, we considered the data using logarithmic regression. The results improve dramatically on this basis, resulting in an R-square of correlation of 96.0% as shown in Figure 5-B.
Despite the high decile-based correlation of discounts and market value-to-book value ratios, our direct (non-grouped) regressions of the transactions reported in the database found weak R-squares of correlation—a topic discussed on Part II of this paper.
Based on the decile analysis, at least, the ratio of market value-to-book value seems to strongly influence restricted stock discounts. The ratio does not, however, represent “balance sheet strength,” and instead represents “blue sky.” The risk of overvaluation associated with substantial “blue sky” is a likely explanation for the increasing discounts reported by Pluris.
- Stock Price Volatility
Pluris did not state a conclusion regarding the association of restricted stock discounts and stock price volatility, but its “Volatility” graph suggests a strong association between the two.
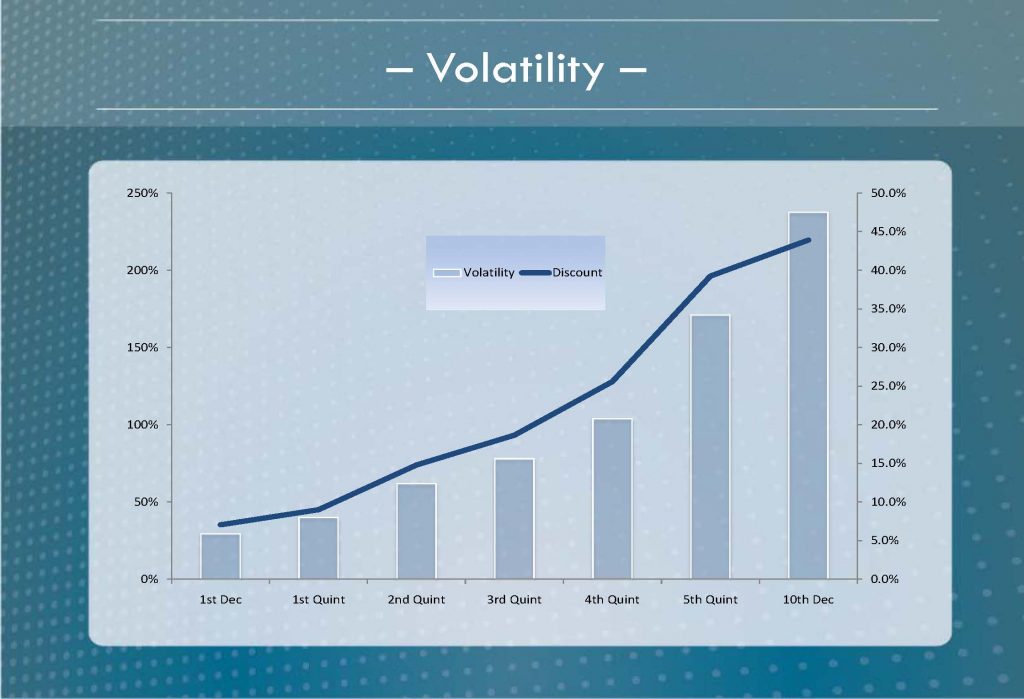 Source: http://www.pluris.com/files/PDFs/Pluris_DLOM_Database_Demo.pdf Source: http://www.pluris.com/files/PDFs/Pluris_DLOM_Database_Demo.pdf |
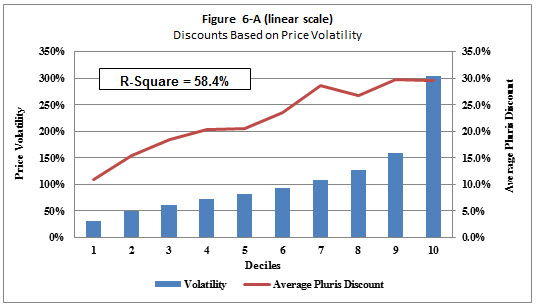
As with its other graphs, the Pluris “Volatility” graph represents a mix of decile and quintile groupings along the x-axis. This, again, distorts the presentation. Figure 6 changes the presentation so that it is comprised exclusively of decile groupings. As shown, decile groupings of the Pluris DLOM Database result in a 58.4% R-square of correlation between price volatility for the 12 months preceding the restricted stock transaction date and the reported transaction discount.
The data supports a conclusion that restricted stock discounts are related to stock price volatility. The Pluris DLOM Database does not, however, establish the appropriateness of a 12-month look-back period for measuring stock price volatility. It is our opinion that the appropriate price volatility assumption for DLOM purposes is the expected volatility for the period of time anticipated to sell the particular nonmarketable investment in an orderly manner. Expectations of future price volatility and selling periods are matters of professional judgment, which may or may not comport with the past.
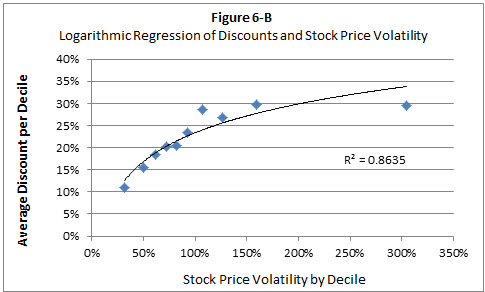
We also considered the relationship of 12-month stock price volatility and restricted stock discounts using logarithmic regression of decile groupings. As with the market value-to-book value ratio, we found a dramatic increase in the R-square of correlation—to 86.4% in this instance as shown by Figure 6-B. Based on the decile analysis, at least, stock price volatility appears to strongly influence restricted stock discounts.
Notwithstanding conclusions regarding the association between price volatility and observed stock discounts, the Pluris methodology for calculating DLOM does not use price volatility as a calculation parameter. Thus, the “Volatility” graph does not add credibility to DLOMs calculated using the Pluris methodology.
[1] Some valuation professionals use other benchmarking devices to estimate DLOM, including the FMV Restricted Stock Study™, pre-IPO transactions, and LEAPS. Such alternatives are not addressed in this paper.
[2] http://www.pluris.com/pluris-dlom-database
[3] http://www.pluris.com/files/PDFs/Pluris_DLOM_flyer.pdf
[4] http://www.privateraise.com/about/about1.php
[5] Pluris DLOM Database Discussion prepared for NACVA on June 5, 2010, at slide 6.
http://www.pluris.com/files/PDFs/Pluris_DLOM_Database_Demo.pdf
[6] This is observed in the “DownloadCalculations” tab of the Pluris spreadsheet download, and may be unique to Pluris DLOM Database Version 4.2.0.
[7] Solitario Exploration & Royalty Corp. Form 8-K dated February 28, 2014.
[8] Derma Sciences, Inc. Form 8-K dated November 8, 2007.
[9] See Pluris DLOM Database and http://www.pluris.com/printer/DLOM-database-construction.
[10] http://www.pluris.com/printer/DLOM-database-construction.
[11] Ibid
[12] Ibid
[13] Ibid
[14] Overvaluing warrants reduces the proceeds attributable to the restricted stock, thereby increasing the gap between the publicly traded price and the supposed restricted stock price.
[15] http://www.pluris.com/files/PDFs/Pluris_DLOM_Database_Demo.pdf
[16] Readers should note that the Pluris methodology for calculating a DLOM does not use three of the five metrics graphed in the NACVA presentation. Only “total assets” and “market value-to-book value” are used in the Pluris calculations of DLOM. Additionally, the methodology relies on six parameters not presented graphically to NACVA. The additional parameters are “equity”, “enterprise value”, “revenues”, “EBITDA”, “net income”, and “net profit margin.” The predictive reliability of the eight parameters actually used in the Pluris calculator is of prime importance to practitioners, which is a topic discussed later in this report. We did not explore the effects on Pluris DLOM calculations of including or substituting the graphed parameters that are not part of the calculator.
[17] We also performed this exercise using logarithmic regression. Again the R-squares of regression increased as the number of data groups decrease.
[18] The increase in R-squares from grouping data also occurs with other regression approaches such as exponential, logarithmic, and polynomial.
[19] http://www.pluris.com/files/PDFs/Pluris_DLOM_Database_Demo.pdf, slide 18.
[20] The R-square of correlation is somewhat less (83.3%) using logarithmic regression.
[21] http://www.pluris.com/files/PDFs/Pluris_DLOM_Database_Demo.pdf at slide 14.
[22] http://www.pluris.com/files/PDFs/Pluris_DLOM_Database_Demo.pdf at slide 15.
Marc Vianello, CPA, ABV, CFF is the Managing Member of Vianello Forensic Consulting, LLC. He is the inventor of the concept of probability-based discount for lack of marketability and is the developer of the VFC DLOM Calculator. Mr. Vianello has written extensively regarding DLOM, the time periods needed to sell privately held businesses, the specific company risks associated with abnormal debt levels, and adjusting cost of capital for prevailing market conditions. Mr. Vianello has testified extensively in Federal and State courts around the country in complex, high dollar financial litigation of all types, including valuation, intellectual property, breach of contract, and shareholder disputes, among others.
Mr. Vianello can be reached at (913) 432-1331 or by e-mail to vianello@vianello.biz.


