Lost Profits and Other Commercial Damages
A Case Study (Part II of II)
This is the second of a two-part article. In the first part, Dr. Needham provided factual background regarding this commercial damages case where he served as plaintiff‚Äôs damages expert‚ÄĒthe case ultimately went to trial. In this second part, Dr. Needham describes the financial data, discovery challenges, the Daubert motion to disqualify him, how the case was decided, and then settled.
QuickRead thanks Dr. Needham for sharing this case.
[su_pullquote align=”right”]Resources:
10 Common Errors in Lost Profits Calculations and Business Damages
Avoid the Hot Seat‚ÄĒ11 Common Pitfalls in Lost Profits and Business Damages Analysis
Anticipating Daubert Challenges
Special Considerations for Lost Profits Calculations
Advanced Concepts in Lost Profits Calculations
[/su_pullquote]
This is the second of a two-part article. ¬†In the first part, Dr. Needham provided factual background regarding this commercial damages case where he served as plaintiff‚Äôs damages expert‚ÄĒthe case ultimately went to trial. ¬†In this second part, Dr. Needham describes the financial data, discovery challenges, the Daubert motion to disqualify him, how the case was decided, and then settled.
Overcharges
Through discovery, the defendant provided a printout of the purchases made by the plaintiff between January 1, 2013 and June 30, 2015.  When placed on an Excel spreadsheet, there were over 12,600 rows of transactions.  The purchase data provided the date of the transaction, the type and quantity of materials and products purchased, the prices charged, and the invoice number.
To calculate the overcharges, the analysis needed to subtract the price that should have been paid from the price paid.¬† The question became, ‚ÄúWhat was the ‚Äėcompetitive market price‚Äô for that material or product when the purchase was made?‚ÄĚ
The defendant claimed privilege and confidentiality when asked to release pricing charged to other customers during the loss period.[1]  A survey of the pricing charged by other distributers over the loss period was considered.  But because of confidentiality in pricing and discounts given to volume purchasers, other distributers were not willing to share the pricing information requested.[2]  The remaining information available were the prices charged on the plaintiff’s purchases during the first two and one half years of the agreement.
Part of the plaintiff’s complaint was the number and size of price increases made by the defendant over the first two years of the contract.
The following table is an example of the defendant’s pricing increases and decreases.
Additional pricing adjustments continued through June 2015.
An assessment of the pricing increases and decreases showed the March 1, 2015 prices were greater than the prices charged at the beginning of the agreement (January 1, 2013) but less than the prices after the first increase that occurred early in 2013.¬† In addition, the defendant had told the plaintiff the adjusted 2015 prices were ‚Äúcompetitive market prices.‚ÄĚ
Because the second quarter 2015 prices were allegedly ‚Äúcompetitive market prices,‚ÄĚ it was decided to apply the 2015 reduced prices against all the purchases made in 2013, 2014, and 2015.¬† The argument made in court was the defendant had increased prices over the loss period to pass along manufacturers‚Äô price increases.¬† The defendant decreased its pricing in 2015 to address the plaintiff‚Äôs concerns over its sales decline.¬† The defendant‚Äôs records showed the plaintiff‚Äôs account continuing to be profitable during the first six months of 2015.¬† Therefore, the 2015 prices would have been ‚Äúcompetitive market pricing‚ÄĚ throughout the loss period (2013, 2014, and 2015).¬† This is because the newly reduced prices included the increased material and product costs incurred by the defendant over the loss period and continued to provide the defendant with profitability.
The most recent pricing for the materials and products was then applied to loss period transactions.  The calculations were simple arithmetic.  The lowest 2015 prices were subtracted from the actual prices paid.  The difference between these transactions was then totaled to show the amount of overcharging.  The plaintiff and our office performed these calculations separately.  In our office, the work took 18 hours of data input alone.  This does not include any time spent for review and analysis.
When the total purchase figures based on the 2015 prices were subtracted from the actual purchase prices, it was found the plaintiff had paid $220,000 (rounded) greater than the 2015 prices.  This figure was claimed at trial as the loss due to overcharges related to actual transactions during the loss period.
The defendant initially argued the prices charged during the loss period were ‚Äúcompetitive market pricing‚ÄĚ based on their definition.¬† In its opinion, no losses had been incurred.¬† However, they also argued, if there were losses, the plaintiff expert‚Äôs loss figures were not helpful to the trier-of-fact in assessing that loss.¬† The defendant said the model for assessing these damages was correct, but the inputs were wrong.¬† The expert should have determined the ‚Äúcompetitive market price‚ÄĚ at the time of each transaction and applied that price against the price the plaintiff was charged.¬† The expert had erred by applying a 2015 price to transactions in 2013 and 2014.¬† The 2015 price did not exist in those years and therefore, could not have been the ‚Äúcompetitive market price.‚ÄĚ
Lost Profits
The calculation of overcharges covered the transactions which took place during the loss period.  The second set of losses were related to the lost revenues from bids not accepted during the loss period and therefore profits not achieved because of the lost revenues.
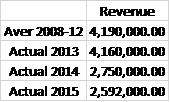
A review of the plaintiff’s financial statements showed a significant drop in 2014 and 2015 revenue when compared to the average annual revenue reported from 2008 through 2012 (the five years prior to the agreement).  The annual revenue figures appeared this way:
Before moving forward with estimating the lost profits, other factors for the decrease in revenue were considered.¬† Experts are expected to provide lost profit calculations with reasonable certainty.¬† Lost profit claims are also reviewed for foreseeability and proximate cause.¬† Foreseeability is seldom disputed in breach of contract litigation‚ÄĒbut, proximate cause is.[3]
A plaintiff’s decrease in revenue, and therefore profits, does not automatically make the defendant the cause of the loss.  There may be other reasons for the decrease.  New competition, changes in technology, a slowdown in the economy, and financial constraints can also lead to a reduction in revenue and lost profits.  Experts should consider factors not related to the lawsuit that may have caused the decrease.  In this case, two factors were considered: a shrinking of the construction market served by the plaintiff, and a loss of customers due to poor performance by the plaintiff.
A review of data from the Federal Reserve Bank of Dallas and construction magazines containing McGraw-Hill Construction and Dodge Construction market outlooks showed construction expanding in the plaintiff’s market during the loss period.  Texas had been impacted by the decrease in the price of oil, but the Dallas Fort Worth area (a market served by the plaintiff) had continued to grow.  Two areas served by the plaintiff, school and private construction, were continuing to expand at a brisk pace.
Documents exchanged between the parties showed the plaintiff had not been sued by any of its customers.  The plaintiff had on four occasions sued customers seeking payment for work performed.  None of its former client’s defenses appeared to be related to poor work by the plaintiff.  Therefore, there appeared to be no loss of clients due to failure to perform or from providing shoddy work.
These findings were included in my report and provided to the jury at trial.  Having considered two of the obvious non-related factors and found no support in those areas for the revenue decline, the assessment of lost profits proceeded.
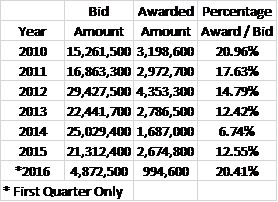
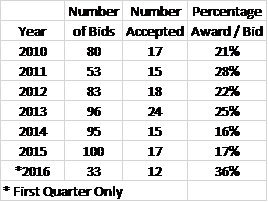
Before assessing the damages, we sought to ‚Äúprove up‚ÄĚ the plaintiff‚Äôs claim.¬† Bid data were reviewed from January 1, 2010 through March 31, 2016.¬† This entailed reviewing over 60,000 pages of documents.¬† From this information, two sets of data were prepared.¬† The first showed the decrease in the dollar amount of accepted bids during the loss period.¬† The second showed the decline in the number of accepted bids from contractors working in a major sector served by the plaintiff (public and private education construction).
Two tables were prepared and shown to the trier-of-fact.  The first table showed the decrease in the dollar amount of bids awarded to the plaintiff.
The decrease in 2013 was attributed to bids not being accepted later in the year after prices were increased.  The increase in 2015 was attributed to bids being accepted in the second half of the year after the plaintiff’s material and product costs had been lowered.  This appeared to be confirmed by the increase in bid acceptance during the first quarter of 2016.
The second table showed the decline in the number of bids accepted for work in the public and private education construction market.¬† The plaintiff‚Äôs largest market segment served was called ‚Äútax-exempt entities.‚ÄĚ ¬†This included public and private elementary and secondary schools, college and medical schools, and non-profit organization construction projects.¬† The table showed the number of bids, the number of accepted bids, and percentage of accepted bids to total bids for elementary and secondary schools as well as college construction projects.
While the percentages were slightly different than the total bid data, the results again supported the plaintiff’s claim that the defendant’s price increases kept them from competing, especially in large projects.
We then turned to assessing what figure could be used to determine the lost profits.  The owner/operators of the plaintiff testified the company’s job profitability goal (profitability of each specific work project) was 22% to 25%.  This job profit margin was the difference between the revenue and the costs directly associated with the work.  General expenses for overhead and office administration were not included.
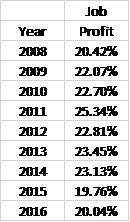
A review of completed and ongoing projects showed the following annual job profitability for 2008 through 2016.
Over the nine years, only three times had the company’s annual job profit margins been outside the owners’ goals.  Twice (2008 and 2015) the annual job profitability was below 22%.  Once (2011) the job profitability was greater than 25%.
Because the plaintiff had continued to operate, its overhead and office administration costs had not been saved.  Through revenue and working capital loans, the plaintiff had already paid for those expenses.  Therefore, it was argued the only saved expenses were those directly related to the lost revenue.  Because of this, the job profitability percentages were applied to the lost revenue.
Although the loss period included 2013, no calculation of lost profits was made for that year.  The 2013 revenues and job profitability margins were comparable to the prior five years; therefore, no lost profits for that year were assumed.[4]
Lost profits were calculated based on the difference between the plaintiff’s average annual revenue for the five years prior to the agreement and the actual revenue generated in 2014 and 2015.  The range of job profitability (22% to 25%) was then applied to each year’s lost revenue.  This provided a range of loss.
The calculations were shown to the trier-of-fact in this way:
Ultimately, the trier-of-fact was given the following range of loss:
The above figure reflected the plaintiff’s losses based on the estimated overcharges and lost profits at a 22% job profitability margin.
The above figure reflected the plaintiff’s losses based on the estimated overcharges and lost profits at a 25% job profitability margin.
The defendant’s expert had used a similar approach in calculating the lost profits incurred by the defendant.  Therefore, little was said at trial about the methodology used to calculate the range of loss.  The defendant’s goal was to place doubt in the mind of the trier-of-fact regarding the accuracy of these calculations.  The defendant’s attorneys attempted to discredit the quality of the plaintiff’s statistics bringing into question the accuracy of the bid and acceptance data.  They also noted the discovery of errors in the initially exchanged job probability reports, which rendered them useless.  I noted the job profitability reports had been corrected and the updated versions used in my analysis.
While not discussed in this article, the defendant attempted to preclude and/or limit my testimony through a Daubert challenge.  The judge reviewed the motion and responses via briefs filed with the court.  The judge ruled I could testify without limitations.  Because I was not directly involved in the motion or responses, I have not included any discussion on it.
Jury Verdict
The trial took place over a two-week period.  Each side presented fact witnesses supporting their loss claims.  Commercial damages experts also testified for both sides.  The experts primarily opined to the lost profits or additional expenses incurred by the side that had hired them.
During the deliberations, the jury forwarded this note to the judge.¬† ‚ÄúWe would like to see Dr. Needham‚Äôs report.¬† A report especially including his analysis of lost profit and overcharges.¬† Can we be given the exhibit number?‚ÄĚ ¬†The report had not been made an exhibit due to the hearsay rules.¬† Therefore, the jury had to work from their memories and notes.
The jury returned a verdict in favor of the plaintiff on all counts.  It awarded the plaintiff more than $1,000,000 in damages, including the full amounts claimed in overcharges and lost profits at the 25% job profit margin.  After the trial, the two sides negotiated a settlement, which included a confidentiality agreement to not disclose the agreed terms.
Conclusion
In most commercial damages assignments, an expert will prepare a lost profits report and be done with the case.  Other times, the expert will be deposed.  In both situations, the case will settle without the expert knowing the impact his or her report had on the outcome.  It is seldom an expert will testify at trial and be made aware of the trier-of-fact’s verdict.  This case study has reviewed an assignment in which I was retained, provided a report, was deposed, and testified at trial.  The jury’s verdict provided insight as to the effect of the expert’s conclusions.
This case study has sought to share the thinking applied in reviewing the claims made by the plaintiff and the use of available information.  I am not saying this is the only way to assess these damages.  Other experts may have approached this matter differently.  It has been my hope that this information would help other experts when confronted with similar situations and assist them in clarifying and presenting commercial losses.
[1] The data were released prior to the beginning of the trial.  However, it was not made available in time to be used in assessing the overcharge claims.
[2] A retail customer purchasing a certain product would pay list price.  A small sub-contractor would receive a slightly discounted price where as a large sub-contractor or general contractor could receive greater discounts due to their volume.  Other vendors were not willing to share their pricing and discounts, and therefore the ultimate pricing for volume purchasers.
[3] See QuickRead articles ‚ÄúForeseeability Standard in Lost Profits Litigation,‚ÄĚ ‚ÄúIncluding Causation in a Lost Profits Analysis,‚ÄĚ and ‚ÄúReasonable Certainty in Lost Profits Calculations,‚ÄĚ for additional information on these topics.
[4] This does not mean the plaintiff did not incur losses in 2013.  The plaintiff was overcharged for items purchased in 2013.  This out-of-pocket loss had been claimed in the overcharge calculations.
Allyn Needham, PhD, CEA, is a partner at Shipp, Needham & Durham, LLC, a Fort Worth-based litigation support consulting expert services and economic research firm. Prior to joining Shipp, Needham & Durham, he was in the banking, finance, and insurance industries for over twenty years. As an expert, he has testified on various matters relating to commercial damages, personal damages, business bankruptcy, and business valuation. Dr. Needham has published articles in the area of financial economics and forensic economics and provided continuing education presentations at professional economic, vocational rehabilitation and bar association meetings.
Dr. Needham can be reached at (817) 348-0213, or by e-mail to aneedham@shippneedham.com.


