Adherence to Development and Reporting Standards in Family Law Litigation
When applied correctly, the Market Approach can link value to market evidence and help support a thorough and well-reasoned valuation. However, valuation analysts often struggle with a variety of challenges when applying the Market Approach that include locating and selecting good comparable companies, selecting or calculating various valuation multiples from reported data, and weighting or selecting indications of value derived from various applied multiples. Recently published research from Doron Nissim at the Columbia Business School at Columbia University NY may shed some light on the best measure of operating performance in the context of equity valuation and, thus, which measures may deserve more weight or consideration in deriving value. All three enterprise value multiples (EBITDA, EBITA, and EBIT) perform reasonably well in explaining market valuations. The superiority of EBITDA, however, in explaining equity valuations means this multiple should be given material consideration in any valuation using a relative valuation approach.

[su_pullquote align=”right”]Resources:
The Three Valuation Approaches—Challenges and Issues
EBITDA Single Period Income Capitalization for Business Valuation
Business Valuation Accelerator Clinic: Valuation Approaches and Methods
The Use of Regression Analysis in the Market Approach
[/su_pullquote]
Struggles with the Market Approach
When applied correctly in the valuation of a closely held company, the Market Approach can link value to market evidence and help support a thorough and well-reasoned valuation. However, valuation analysts often struggle with a variety of challenges when applying the Market Approach that include locating and selecting good comparable companies, selecting or calculating various valuation multiples from reported data, and weighting or selecting indications of value derived from various applied multiples. These challenges, many times, result in the complete abandonment of the Market Approach, weakening the link to market evidence of value. Fortunately, recently published research from Doron Nissim (Nissim) at the Columbia Business School at Columbia University NY (Columbia)[1] may shed some light on the best measure of operating performance in the context of equity valuation and, thus, which measures may deserve more weight or consideration in deriving value. This article reviews their research and conclusions that earnings before interest, taxes, depreciation, and amortization (EBITDA) does a better job at explaining equity market valuations over earnings before interest, taxes, and amortization (EBITA) which, in turn, does a better job over earnings before interest and tax (EBIT).
Rise in Intangibles
Nissim reports that there has been a rise in the intensity of intangible assets at companies over the last 50 plus years. This rise includes those organically developed and otherwise unreported in financial statements as well as those acquired and subsequently recorded in financial statements following purchase accounting. A number of elements have contributed to this increase, including the following:
- The evolution of the U.S. from an industrial economy to a knowledge-based economy.
- Investments in technological expertise and other components of intellectual capital.
- The change in 2002 to the use of the purchase method only for the accounting of business combinations.
- The revisions in 2007 to accounting standards for business combinations that generally increased the recognition of intangibles and amortization charges.
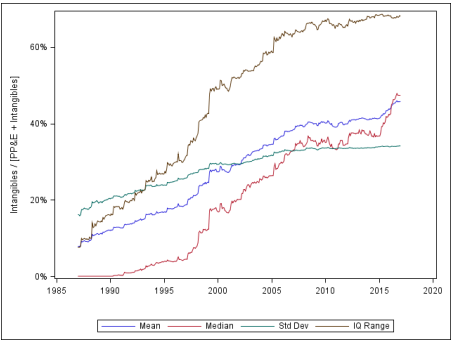
The following figure summarizes the rise in intangible assets at U.S. public companies since 1987. The figure shows a strong positive trend in the mean percentage of intangible assets to total fixed and intangible assets from under 10% to over 40% in 2016.
Figure 1: Intangibles as % of Total PPE and Intangibles
Returns to All Claim Holders
In his study, Nissim focuses on performance measures providing a return to both debt and equity capital, namely EBITDA, EBITA, and EBIT. EBITA is a less familiar acronym but is gaining use as a return measure to invested capital. While these return measures to invested capital are commonly utilized in practice to analyze the performance of companies, a related analysis that has emerged is the calculation of returns on tangible capital instead of or in addition to returns on invested capital. Tangible capital is calculated by subtracting the book value of intangible assets and goodwill from total invested capital. Nissim outlines advantages and disadvantages with the three return measures as summarized below.
EBITDA is commonly used in practice as a return measure to invested capital. EBITDA has likely garnered widespread use because of challenges and/or limitations in the calculation and subtraction of depreciation and amortization reflected in other return measures. Accordingly, the exclusion of depreciation and amortization as expenses from profit measures may lead to better comparability across companies and sectors. The following distortions are removed from income measures with the use of EBITDA:
- Differences in the timing of asset purchases and inflation rates;
- Latitude in assumptions regarding an assets’ useful lives and salvage value;
- Substantial discretion in an intangible asset’s cost/value, useful life and resulting amortization, and any impairment costs; and
- Management’s additional discretion over asset capitalization policies and the inclusion of financing costs in capitalized assets.
However, Nissim points out that ignoring depreciation and amortization because they are “non-cash” expenses and occurred in the past can be problematic. EBITDA may overstate free cash flow—a primary driver of value—in the long-term since it is quite likely a company will have to invest in additional assets over time. Warren Buffett made this point in his 2002 letter to Berkshire Hathaway shareholders:
“Trumpeting EBITDA is a particularly pernicious practice. Doing so implies that depreciation is not truly an expense, given that it is a ‘non-cash’ charge. That’s nonsense. In truth, depreciation is a particularly unattractive expense because the cash outlay it represents is paid up front, before the asset acquired has delivered any benefits to the business. Imagine, if you will, that at the beginning of this year a company paid all of its employees for the next ten years of their service (in the way they would lay out cash for a fixed asset to be useful for ten years). In the following nine years, compensation would be a “non-cash” expense—a reduction of a prepaid compensation asset established this year. Would anyone care to argue that the recording of the expense in years two through ten would be simply a bookkeeping formality?”
As indicated, EBITA is gaining ground as an income metric of the return on invested capital. EBITA has likely picked up momentum because of the rise and influence of intangible assets and goodwill in income measures and challenges and/or limitations in the calculation and subtraction of amortization, some of which were outlined above. The following distortions are removed from invested capital income measures with the use of EBITA:
- The lack of the cost of fixed assets in income measures;
- Differences in the relative mix of capital leases and operating leases;
- Differences caused by the inclusion of depreciation in work-in-process and finished goods inventories and the effects on costs of goods sold;
- Latitude in the expensing or capitalization of expenditures with discretion in classifying expenditures as improvements, additions, or replacements; and
- Differences caused by the inclusion of financing costs in capitalized fixed assets.
However, EBITA will distort comparability of income measures caused by decisions to invest in and expense internally-generated intangibles or acquire from others the same type of intangibles. EBITA can overstate income returns in acquisitive companies since post-acquisition EBITA does not reflect the historical cost of developing acquired intangibles.
EBIT is shadowed by the use of EBITDA and, increasingly, EBITA. EBIT’s rank of second-fiddle is likely caused by some of the distortions summarized above. The following distortions are removed from invested capital income measures with the use of EBIT:
- The lack of the cost of intangible assets in income measures; and
- Differences in the relative mix of internally-developed intangible assets versus acquired intangible assets.
EBIT may provide a more long-term view of sustainable profitability.
The Best Enterprise Value Multiple
In his study to measure the effectiveness of invested capital income measures to explain equity valuations, Nissim used monthly data on U.S. public companies during the period January 1987 through December 2016 with available Compustat and CRSP information. He excluded small firms with total assets and revenue each less than $25mm and financial firms since invested capital income measures of these firms have a different interpretation. Nissim then used the invested capital valuation multiples (Enterprise Value [EV]/EBITDA, EV/EBITA, and EV/EBIT) to derive or predict the equity price of the public companies over the same time period. The predicted price was then converted to the percentage pricing error (%PE) using (Actual Price less Predicted Price)/Actual Price. This percentage pricing error was compared across invested capital income measures.
In his study, Nissim made some noteworthy adjustments in his calculation of EV multiples:
- EV was measured for each public company as the sum of the market value of equity, plus the estimated value of contingent claims, plus the estimated value of noncontrolling interests, plus the estimated value of preferred stock, plus the book value of debt, minus the book value of excess cash and short-term investments, minus the estimated value of equity method investments, and minus the book value of other long-term investments;
- Cash was normalized;
- Book value was used for the value of debt; and
- Resulting multiples were adjusted for any debt and equity capital changes.
Density curves of the percentage pricing errors were developed for each of the three invested capital income measures. If stock prices are efficient, a tight distribution around zero implies that most %PEs are small and valuations are accurate from the EV multiples. Figure 2 below summarizes the distribution of %PEs for each of the three income measures. Nissim also calculated the absolute percentage pricing errors in order to make comparisons across invested capital income measures.
Figure 2: Distribution of Percentage Pricing Errors
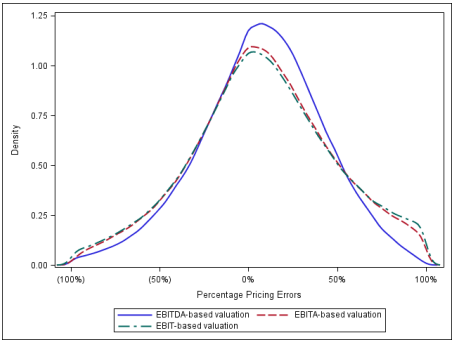
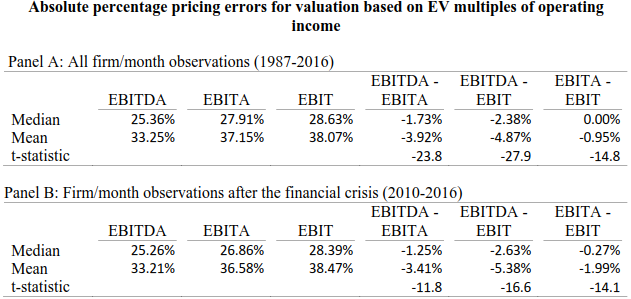
All three enterprise value multiples did a good job of explaining equity value with more than 50% of the valuations within 30% of price. As indicated in Figure 2 summarizing the distribution of %PEs, EBITDA has a tighter distribution than that of EBITA and EBIT with the height of the density curves close to zero. The distribution of EBITA and EBIT are similar with EBITA slightly tighter. Nissim drew these conclusions from his analysis:
- With a tighter distribution in %PEs, EBITDA was superior in explaining equity values; and
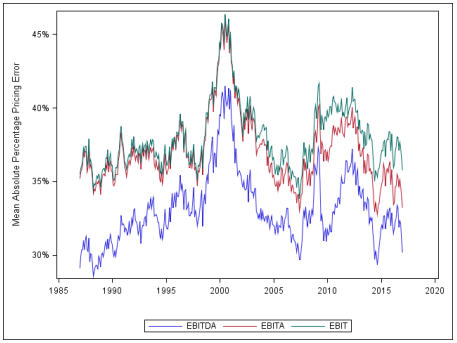
- The relative accuracy of EBITA increased over time and the difference between EBITDA and EBITA has narrowed as show in Figure 3 below with the red EBITA line moving closer to the blue EBITDA line. This reflects the significance and influence of amortization over time.
Figure 3: Mean %PE Over Time
Takeaways
This study compares the three alternative invested capital income measures—EBITDA, EBITA, and EBIT in their ability to explain market valuations. All three EV multiples using these income measures perform reasonably well in explaining market valuations. According to the author’s study, EBITDA is better than EBITA and EBIT, and EBITA is better than EBIT. However, EBITDA and its related EV multiple should not be the only measure given the potential inherent accounting distortions. The superiority of EBITDA in explaining equity valuations means this multiple should be given material consideration in any valuation using a relative valuation approach. EBITA analysis and related multiples should be more widely adopted by valuation analysts as an alternative measure since this income measure has shown improvement in its ability to explain equity valuations.
[1] https://papers.ssrn.com/sol3/papers.cfm?abstract_id=2999675
[divide] Kevin Couillard, ASA, CFA, MBA, is Executive Director, Business Valuation & Litigation Support at FairValue Advisors, LLC. He has been qualified as a testifying expert on valuation matters and commercial damages in various U.S. Federal and State courts and alternative resolution panels. Mr. Couillard has provided expert opinions on various valuation matters including matrimonial disputes and various commercial damages. He has been a guest speaker and lecturer on business valuation topics for a number of professional and trade organizations.
Mr. Couillard can be contacted at (678) 291-9512 or by e-mail to kevin@fairvalueadvisors.com.