The Discount Period for the Terminal Value
Is Not Debatable
This article explains why the undiscounted terminal value as of a future date must be discounted back by (a) N – 0.5 years when the traditional perpetuity method with a mid-period convention is used, (b) N years when the traditional perpetuity method with an end-of-period convention is used, or (c) N years when an exit multiple is used.
This article explains why the undiscounted terminal value as of a future date must be discounted back by (a) N – 0.5 years when the traditional perpetuity method with a mid-period convention is used, (b) N years when the traditional perpetuity method with an end-of-period convention is used, or (c) N years when an exit multiple is used.
Introduction
Valuation disputes often resemble political disputes. Two valuation practitioners frequently arrive at very different views when looking at the same information. Moreover, it is often difficult to definitively prove which practitioner made the “correct” judgment-based determination.
However, some valuation disputes are not worth debating. The “correct” answer is obtainable because the debate is over facts, not judgments. One example is the discount period used to convert an undiscounted terminal value as of a future date into its present value as of the valuation date.
So why write an article about something that is not debatable? As a practitioner who focuses on valuation-related disputes, I sometimes must address a report written by another practitioner who uses the “incorrect” discount period. It is for this reason that I decided to write an article that explains the issue.
Discounting the Discrete Projection Period
Nobody disputes how to discount the discrete projection period. To demonstrate this concept, we will use an example with a January 1, 2018 valuation date and a five-year discrete projection period.
The free cash flow is assumed to occur in the middle of the year (on June 30 for a calendar-based company) when the mid-period discount convention is used.[1] Year one (2018) free cash flow is discounted back by 0.5 year because the first-year free cash flow is effectively received 0.5 year (on June 30, 2018) after the January 1, 2018 valuation date. Each subsequent year’s free cash flow is discounted back by an additional year (e.g., year two’s free cash flow is discounted back by 1.5 years).
The free cash flow is assumed to occur at the end of the year (on December 31) when the end-of-period discount convention is used. Year one (2018) free cash flow is discounted back by 1.0 year because the first-year free cash flow is received 1.0 year (on December 31, 2018) after the January 1, 2018 valuation date. Each subsequent year’s free cash flow is discounted back by an additional year (e.g., year two’s free cash flow is discounted back by 2.0 years).
See Figure 1 for a comparison of mid-period and end-of-period discounting periods for the five-year discrete projection period. Notably, the discount periods for the mid-period convention is always 0.5 years lower than the discount periods for the end-of-period convention.
Figure 1
| Year | Mid-Period | End-of-Period |
| 1 | 0.5 | 1.0 |
| 2 | 1.5 | 2.0 |
| 3 | 2.5 | 3.0 |
| 4 | 3.5 | 4.0 |
| 5 | 4.5 | 5.0 |
Discounting the Terminal Value: Perpetuity
The undiscounted terminal value as of a future date must be discounted back by the same number of years as the last year’s free cash flows. In the above example with a 5.0-year (N = 5) discrete projection period, the undiscounted terminal value is discounted back by 4.5 (N – 0.5) years when the mid-period convention and by 5.0 (N) years when the end-of-period convention is used. Most perpetuity-based terminal values must be discounted back by N – 0.5 years because most valuations are performed under the mid-period convention.
Some practitioners argue that the undiscounted terminal value should always be discounted back by 5.0 (N) years. There is some surface logic to their view as they believe the terminal value at the end of year 5.0 (N) should be discounted back by 5.0 (N) years, not 4.5 (N – 0.5) years. There appears (at least superficially) to be an internal inconsistency when the value as of 5.0 (N) years in the future is discounted back by only 4.5 (N – 0.5) years.
Build a Model that Extends “Forever”
Perhaps the best way to definitively address this issue is to create a model that goes waaaay out into the future. Businesses valued under the going concern assumption are assumed to operate forever. The terminal value captures the present value of expected cash flows from the first day after the discrete projection period ends (January 1, 2023, in this example) through the end of time.
Fortunately, we do not have to create a discrete projection period model that literally extends into perpetuity. The present value of expected free cash flows declines each year during the residual period because the long-term growth rate is lower than the discount rate. Thus, the present value of expected free cash flows becomes de minimis at some point.
To demonstrate this concept, consider a business valuation as of January 1, 2018 that is essentially a perpetuity. During 2017, this business had $100 million in sales, a 20% EBITDA margin, 30% effective tax rate, depreciation and capital expenditures are each equal to five percent of sales, and working capital is equal to 10% of sales. This business is expected to grow at three percent per year forever and all assumptions remain constant (e.g., EBITDA remains at 20% of sales) over time.[2] As shown in Figure 2, the free cash flow for this business increases by three percent per year.
Figure 2
| Sales Growth | EBITDA Margin | Effective Tax Rate | Depreciation | Capital Expenditures | Working Capital | Free Cash Flow | Free Cash Flow Growth | |
| 2018 | 3.0% | 20% | 30% | 5% | 5% | 10% | 10.5 | |
| 2019 | 3.0% | 20% | 30% | 5% | 5% | 10% | 10.8 | 3.0% |
| 2020 | 3.0% | 20% | 30% | 5% | 5% | 10% | 11.2 | 3.0% |
| 2021 | 3.0% | 20% | 30% | 5% | 5% | 10% | 11.5 | 3.0% |
| 2022 | 3.0% | 20% | 30% | 5% | 5% | 10% | 11.8 | 3.0% |
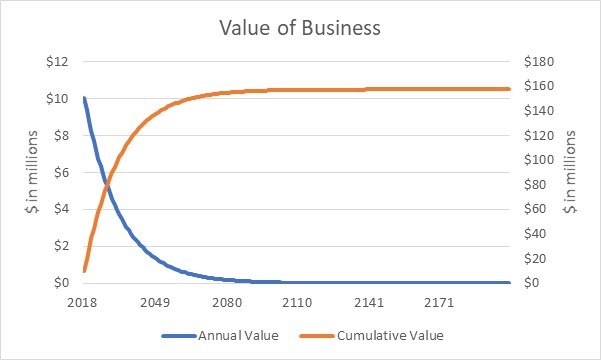
We can extend the model in Figure 2 “forever” by adding additional years after 2022 in which free cash flow increases by three percent per year for each year that is added to the model. See Figure 3 for the output of a model that extends the forecast in Figure 2 to the year 2200 and uses a 10.0% discount rate with the mid-period convention.
Figure 3
The blue line in Figure 3 is the present value for each year’s free cash flow. The present value of free cash flow for this business is about $10 million in the first year (2018). To focus on round numbers, the present value of annual free cash flow for this business declines (a) to about five million dollars by 2029, (b) to about one million dollars by 2053, and (c) to less than $0.05 (rounds to $0.0) million dollars by 2099. By 2200, the present value of annual free cash flow has declined to $0.000064 million ($64) dollars, which clearly is de minimis for this business.
The orange line in Figure 3 is the cumulative present value of each year’s free cash flows. Notably, the cumulative present value for the 60-year period from 2141 to 2200 rounds to $0.0 million, which is demonstrated by the flat orange line during that 60-year period. Thus, it is reasonable to conclude that extending the model to the year 2200 in this example is effectively “forever” for valuation purposes.
What is the value of this business? The present value of free cash flows during the very long discrete projection period (2018 thru 2200) is $157.5 million. The present value of the terminal value is $0.0 million (whether N or N – 0.5 periods is used, which renders the debate irrelevant). Thus, this business is worth $157.5 million.
Compare “Forever” Valuation with Traditional Valuation
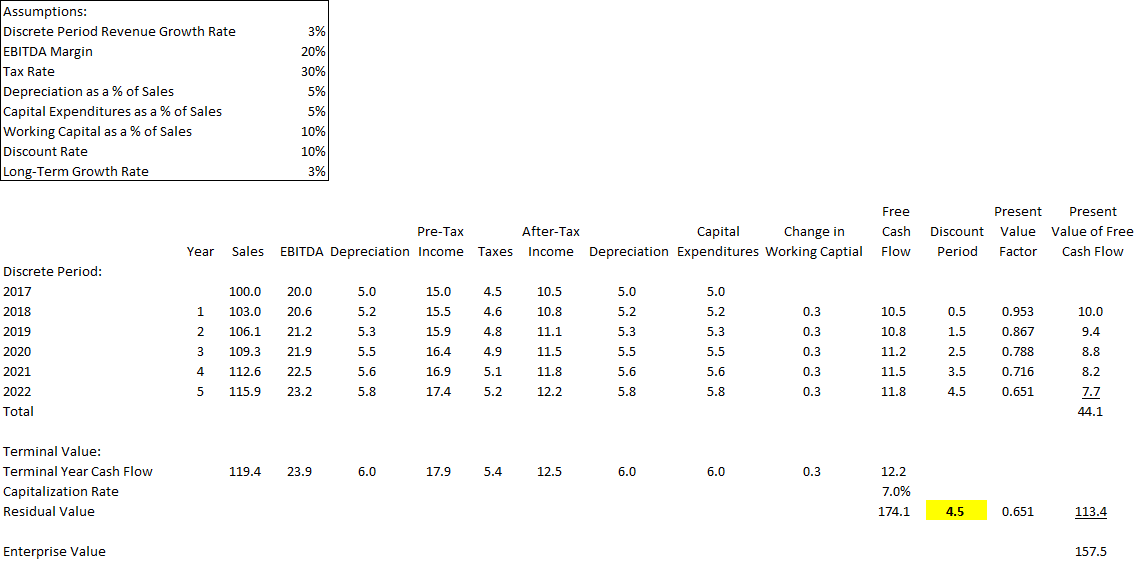
How does this “forever” valuation compare with a traditional two-stage valuation that has a five-year discrete projection period and a terminal value? As shown in Figure 4, a traditional two-stage valuation that discounts the terminal value at the end of year five back by 4.5 years results in a $157.5 million valuation, which is the same as the “forever” valuation in Figure 3. This direct test confirms that discounting the terminal value back in this example by N – 0.5 (4.5) years is correct.
Figure 4: Value with Terminal Value Discounted Back at N – 0.5 Years
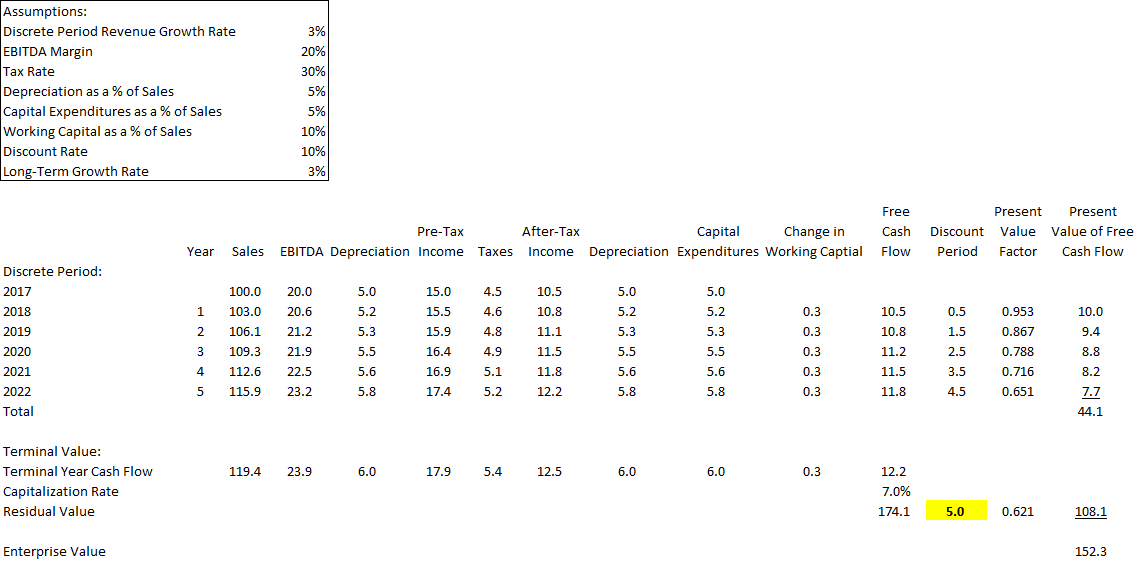
As shown in Figure 5, a traditional two-stage valuation that discounts the terminal value at the end of year five back at 5.0 years results in a $152.3 million valuation, which is lower than the “forever” valuation in Figure 1. This direct test confirms that discounting the terminal value back in this example by N (5.0) years is wrong.
Figure 5: Value with Terminal Value Discounted Back at N Years
Why is N – 0.5 Years Correct?
The traditional perpetuity model is somewhat more nuanced than it may appear. The traditional perpetuity model is a simple formula: next year’s cash flow is the numerator and the capitalization rate (discount rate less long-term growth rate) is the denominator. However, there is one important nuance: the perpetuity model assumes each year’s cash flows are received at the end of the year. This assumption is inconsistent with a valuation based on a mid-period convention, which assumes each year’s cash flows are effectively received at the middle of the year.
There are two ways to fix this internal inconsistency. The undiscounted terminal value that assumes cash flows are received at the end of each year can be (a) increased to reflect an additional six-month return equal to the discount rate or (b) discounted by a period that is six-months (N – 0.5) before the discrete projection period ends. Either fix results in the same value.
To demonstrate the concept, we will focus on Figures 4 and 5. The present value of the terminal value is $113.4 million when the $174.1 million undiscounted terminal value (which assumes free cash flows are received at the end of each year) is discounted back for 4.5 (N- 0.5) years. As shown in Figure 6, the same $113.4 million present value of the terminal value is obtained when the $174.1 million undiscounted terminal value (which assumes free cash flows are received at the end of each year) is “grossed up” to reflect a six-month return and then discounted back for 5.0 (N) years.
Figure 6
| Undiscounted Terminal Value per Figure 4 | 174.1 | ||||
| Mid-Period Adjustment (10% Return for 0.5 Years) | X | 1.049 | |||
| Adjusted Value | = | 182.6 | |||
| Present Value Factor when N = 5 per Figure 5 | X | 0.621 | |||
| Present Value of Terminal Value | = | 113.4 | |||
Potentially Confusing Guidance in Valuation Texts
Some valuation books (e.g., Pratt’s Valuing a Business, Fifth Edition at p. 230) say a “common error” is to discount the terminal value by N + 1 periods instead of the correct N periods. These books often do not say the terminal value should be discounted back by N – 0.5 periods within the “common error” section.
Interestingly, valuation books that say the terminal value should be discounted by N periods highlight the need to make the mid-period adjustment, albeit sometimes in a different chapter. For example, Pratt’s Valuing a Business, Fifth Edition at p. 253 says the terminal value based on the perpetuity model should be grossed up (aka “modified”) when the mid-period discounting convention is used along the lines shown in Figure 6. Pratt’s Valuing a Business, Fifth Edition also explains in footnote 8 on p. 254:
“If midyear discounting is used, a mathematical equivalent to using the modified (midyear) capitalization model is (1) to use the standard capitalization model (typically the Gordon growth version) and (2) to discount the indicated terminal value by N – 0.5 periods. While this procedure produces exactly the same answer, it seems that using the modified capitalization formula is a conceptually preferable presentation. This is because the modified formula., along with explanatory text, would make it easier for the valuation reader to understand the calculations.”
As a practical matter, it appears that anyone who focuses on the N periods in the “common error” section when not making an adjustment for the mid-year convention when appropriate does not read the “explanatory text” in other sections that addresses the need to make an adjustment.
Relevance of This Issue
The amount of the understatement is driven by two factors: (a) the discount rate and (b) the percentage of total value that is from the terminal value.
Discount Rate
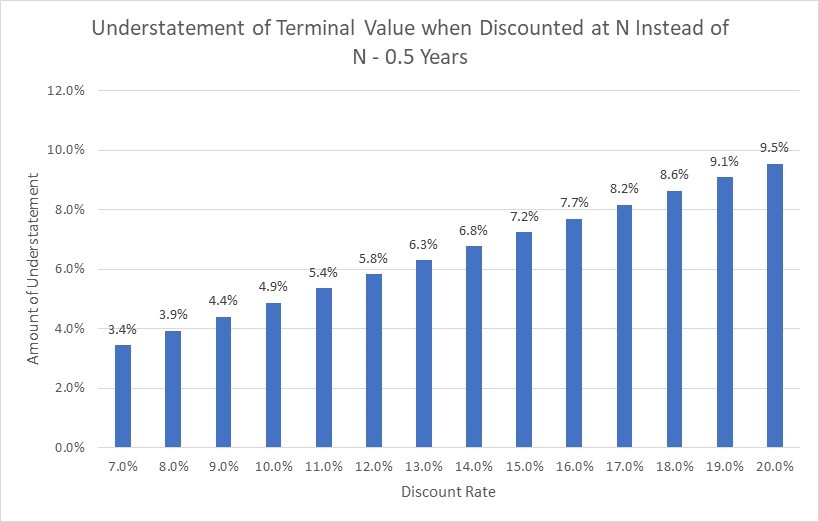
The amount of the understatement increases as the discount rate increases. As shown in Figure 7, the amount of the terminal value understatement increases from 3.4% with a 7.0% discount rate to 9.5% with a 20.0% discount rate.
Figure 7
The 4.9% understatement with a 10.0% discount rate shown in Figure 7 is the same understatement as shown in Figures 4 and 5 as the $113.4 million terminal value in Figure 4 is 4.9% higher than the $108.1 million terminal value in Figure 5.
Percentage of Total Value from Terminal Value
The total understatement is less than the amount shown in Figure 7 because this issue does not affect the discrete period. The understatement will be closer to the amount in Figure 7 when the discrete period is relatively short than when the discrete period is relatively long.
In the example used in this article, the difference between Figures 4 ($157.5 million) and Figure 5 ($152.3 million) is 3.5%. This difference (3.5%) is 71% of the 4.9% understatement of the terminal value. The difference would increase if the discrete period was lesser than five years and decrease if the discrete period was greater than five years.
Discount Period for Exit Multiples
A terminal value based on exit multiples reflects the value of all future cash flows after the discrete period ends and is expressed in the dollar amount as of the date the discrete period ends. There is no need to make an adjustment for mid-period discounting. Thus, terminal values based on exit multiples must be discounted back for N (5.0 years in this example), not what was used in the last year of the discrete projection period (4.5 years in this example) when the mid-period convention is used.
Conclusion
While some may debate how to discount back the terminal value, the methodology is not debatable. The terminal value based on a perpetuity model must be discounted back by the same number of periods as the last year’s free cash flow during the discrete projection period, which is N – 0.5 years when the mid-period convention is used, and N years when the end-period convention is used. The terminal value based on an exit multiple must be discounted by the length of the projection period (N) years.
[1] Many practitioners will say they assume the free cash flow is generated ratably throughout the year. This assumption is functionally the same as free cash flow being generated in one lump sum at the mid-point of the year. As a practical matter, it is much easier to model one lump sum free cash flow amount in the middle of the year than 365 (or 366) free cash flow amounts for each day of the year.
[2] This example is a perpetuity (can be modeled as a one-stage DCF) instead of the traditional two-stage DCF to avoid nuances such as normalizing changes in working capital in the terminal year, which would make the example somewhat more complicated. Nevertheless, this example will be shown as a two-stage DCF so that it follows the traditional structure.
Michael Vitti, CFA, joined Duff & Phelps in 2005. Mr. Vitti is a managing director in the Morristown office and is part of the Disputes and Investigations practice. He is also a member of the firm’s Complex Valuation and Bankruptcy Litigation group, focusing on issues related to valuation and solvency. Mr. Vitti has more than 20 years of valuation experience.
Mr. Vitti can be contacted at (973) 775-8250 or by e-mail to michael.vitti@duffandphelps.com.


