Asset Values (Part I of III)
This is a three-part article that focuses on valuing nonprofit corporation assets. Valuation analysts are commonly engaged to provide fair market value guidance related to nonprofit business transactions. Nonprofit businesses are often involved in arms-length transactions. Common transactions include royalty payments for the use of intellectual property, royalty revenue earned by licensing intellectual property, sales of assets, and purchases of assets. If the subject transaction is between a nonprofit and a related party, the transaction is required to be a fair market value transaction. This series provides an example of certain steps and procedures that can be used to value the assets of a nonprofit business.
Introduction
According to the website, upcounsel.com, there are over 1.6 million nonprofit organizations in the U.S.[1] There are 27 different types of nonprofit organizations with differing rules and requirements. This article will focus on 501(c)(3), the most common type of nonprofit organization. The 501(c)(3) type organization is typically involved in religious work, educational pursuits, charity work, and scientific discovery. All 501(c)(3) type organizations are tax-exempt.
According to the website, irs.gov, for an organization to be tax-exempt, an organization must be organized and operated exclusively for exempt purposes set forth in section 501(c)(3), and none of its earnings may inure to any private shareholder or individual.[2] In addition, it may not be an action organization, i.e., it may not attempt to influence legislation as a substantial part of its activities and it may not participate in any campaign activity for or against political candidates. If the organization engages in an excess benefit transaction with a person having substantial influence over the organization, an excise tax may be imposed on the person and any organization managers agreeing to the transaction.
It is far more common for a valuation analyst (analyst) to be engaged to estimate an arms-length royalty rate for a nonprofit client than to estimate the value of the nonprofit corporation—or its assets. However, the selection of an arms-length royalty rate is often an essential procedure in the valuation of a nonprofit business asset. For example, if an analyst intends to use a relief from royalty method to value an asset, the analyst will prepare a comparable uncontrolled transaction (CUT) method analysis. The preparation of the CUT analysis provides support for, and informs the selection of, an arms-length royalty rate.
A nonprofit corporation can be valuable even if it loses money because it provides public services free of charge. That is because nonprofit corporations typically have identifiable intangible assets. A nonprofit business may have intangible assets that include customer lists, developed technology, trade name, trademark, and workforce. A non-income producing asset may have value to the current business owner and/or to a hypothetical acquirer. If a valuation analysis is based on a highest and best use premise, the analyst should consider the (1) income contribution of a subject asset and (2) cost savings of owning the subject asset. In other words, the value of a non-income producing asset may yield its highest and best use value based on the avoided cost savings to recreate the asset.
To value a nonprofit business, or its assets, an analyst will consider the financial performance of the nonprofit. Some nonprofit corporations regularly lose money, some break even, and some regularly generate income. From a financial statement accounting perspective, nonprofit businesses report operating financial metrics in a slightly different format than for-profit businesses. For example, nonprofit businesses recognize income on financial statements as the “change in net assets.” The change in net assets may be inclusive of monetary contributions, grant income, and fee income related to services.
There are three primary discussion topics presented in this article and incorporated in the valuation example provided herein. First, this article provides procedural guidance on how to value certain nonprofit organization assets. Second, it also addresses the selection of arms-length royalty rates for established technologies and other intangible assets. And, finally, it addresses general valuation best practice concepts applied in the valuation of the total assets of a nonprofit business.
As a best practice, it is recommended—but unfortunately not always possible—that analysts use more than one method to arrive at—or support—a valuation conclusion. Additional method(s) can be used as a reasonableness check to compare to valuation conclusions. In certain situations, a supporting method may be used only as a tool to support an established value and not relied on to establish a value.
The following example provides a contextual framework for the three primary discussion topics presented in this article.
Hypothetical Example: Net Nonprofit Corporation Background
Net Nonprofit Corporation (the Company or NNC) was founded in 2010 by John Allen Doe. The Company is a nonprofit public benefit corporation organized under the Virginia Nonprofit Public Benefit Corporation Law for charitable purposes. The Company is also organized and operated exclusively for charitable purposes within the meaning of Sections 170(c)(2) and 501(c)(3) of the United States Internal Revenue Code of 1986, as amended.
NNC is dedicated to providing research related to medical diagnostic and scientific breakthrough discoveries. NNC has developed technology that is used in classrooms to instruct medical students on current developments and medical research best practices.
The primary sources of NNC’s revenue are grants, contributions, and some fees for services. Revenue has increased significantly since the inception of the Company in 2010.
NNC management identified its primary intangible assets as: (a) the NNC trademark, (b) customer relationships, (c) the NNC software delivery platform, (d) education provided content, and (e) media evaluation content.
Employees
According to NNC management, NNC has enjoyed relatively low employee turnover since inception. NNC has a total of 200 employees. Its employees work in areas that include medical research science, copywriting, editing, web development, marketing, consumer research, communication, laboratory technology, and administration.
NNC Customer Relationships
NNC’s paying customers pay NNC for its scientific delivery platform analysis and review content. The fees NNC receives from this service line represents the only service-related revenue NNC enjoys.
All other revenue related income that is reported on NNC’s statement of activity and changes in net assets are derived from contributions and donations. Some of the Company’s customers include: Science Magazine, Journal of Biotechnology; Journal of Materials Science, Journal of Biology, Cell Magazine; YouTube; Hulu, LLC; and Apple Inc.
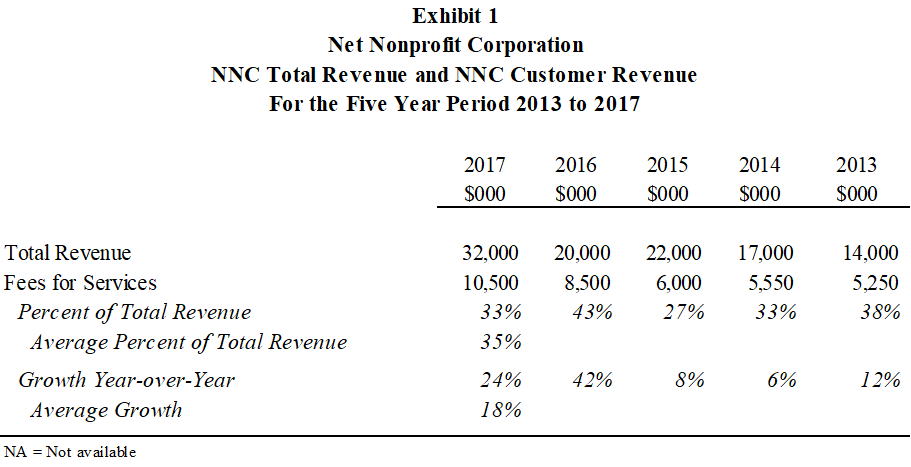
Exhibit 1 illustrates NNC total revenue and NNC fee revenue the Company has enjoyed over the past five years. Over this period, NNC total revenue increased by 18 percent on average. Also, over this five-year period, the NNC fee revenue has averaged 35 percent of total revenue (for use herein, total revenue includes contributions and grants).
NNC has approximately $15 million in asset value comprised of cash, short-term investments, pledges and grants receivable, accounts receivable, prepaid expenses, and equipment leasehold improvements.
Pledges and grants receivable have accounted for the largest amount of total assets since 2013. This increase is primarily due to the Company’s success in attracting contributions and donations. As of December 31, 2017, pledges and grants receivable represented approximately 59 percent of total assets.
Short-term investments are the second largest amount of total assets. The recorded value of short-term investments peaked in 2015. This recorded value has decreased since then as the Company has increased its total revenue base.
NNC liabilities are comprised of accounts payable and accrued expenses and deferred revenue, which are all current liabilities accounts. These accounts have remained relatively constant over the historical period and represent approximately 15 percent of total liabilities and net assets as of December 31, 2017.
The majority of the recorded balance of total liabilities and net assets has been attributable to net assets. In the early years of the historical period, from 2010 to 2013, unrestricted net assets represented the majority of the recorded balance ranging from 50 percent to 70 percent of total liabilities and net assets.
As of December 31, 2017, NNC had a recorded book value of $13 million in net working capital and net fixed assets. It also had a recorded book value of $500,000 of short-term interest-bearing debt obligations.
Total NNC revenue increased throughout the period. The increase is primarily due to an increase in multiyear contributions.
Over the past few years, total revenue increased by a compound annual growth rate (CAGR) of 13 percent.
Over the same period, total expenses increased by a CAGR of 16 percent. The increase in expenses represent the Company’s investment in employees as it builds its large database of education related content.
NNC generally operates at an income loss in most years. Therefore, its change in net assets generally indicates a decrease in most years. For fiscal year 2017, NNC generated positive income as it recorded a significant increase in contributions and grant monies.
Hypothetical Valuation Assignment
In fiscal year 2018, NNC intends to start a for-profit business operation that will share certain assets and activities with NNC. The new business will be organized as a subchapter C corporation. In addition to sharing the use of certain NCC intellectual property, NNC management is considering selling certain NNC intangible assets to the new for-profit business. Because NNC may share certain assets, NNC also needs to establish arms-length royalty rates to be paid to NNC for the use of its intellectual property by the new business.
The objective of this analysis is to (1) estimate the fair market value of certain intangible assets of NNC as of December 31, 2017 (the valuation date), and (2) estimate an arm’s-length transfer price for certain of the NNC intangible assets.
These NNC intangible assets are specified as follows and defined as the “subject assets”:
Group 1—Brand Intangible Assets
Trademark
Group 2—Customers and Software Platform Intangible Assets
Customer Relationships
NNC Software Delivery Platform
Group 3—Content Intangible Assets
Education Provided Content
Media Evaluation Content
The NNC subject assets analysis is based on the premise of value in continued use, as a going-concern business enterprise. For the purpose of this example, this premise of value represents the highest and best use of the subject assets.
As a hypothetical condition to the conclusions provided in this report, the NNC subject assets value was based on the simplifying assumption that NNC was operated as a for-profit entity.[3] Although NNC is organized and operated as a nonprofit entity, in this case, the most likely buyer for NNC’s assets would be a for-profit entity. A typical for-profit entity would use the subject assets in a profit maximizing capacity. Therefore, the analysis is based on the explicit assumption that NNC is a for-profit entity.
In addition to estimating the value of the subject assets, this analysis provides an estimate of an arm’s-length transfer price for some of the intangible assets in Group 1 and Group 3.
Intangible Asset Valuation Methods
For this example, the following eight intangible asset valuation methods were considered to value the subject assets. More specifically, this example contemplated the use of four Income Approach methods including: the (1) yield capitalization method, (2) profit split method, (3) multi-period excess earnings method (MPEEM), and (4) distributor method. The Market Approach-related methods considered include (5) relief from royal method and (6) CUT method. Cost Approach methods considered include the (7) reproduction new less depreciation method and (8) replacement cost new less depreciation method.
The yield capitalization method was not used because this valuation method involves projected economic income or cost savings in perpetuity. The only intangible asset of the subject assets that enjoys projected economic income or cost savings in perpetuity has a highest and best use value estimated by using another valuation method.
The profit split method was not used because this valuation method is typically employed when two parties are working together in a joint venture where the economic income or cost savings attributable to the intangible asset are required to be split among the parties. Since NNC does not currently have this type of arrangement with another party, the profit split method is not applicable.
The distributor method was not used because NNC customers are primarily end-users and not wholesalers or distributors.
The replacement cost new less depreciation method was not used because the NNC assets are specific to the NNC business and cannot be replaced. These assets can, however, be reproduced.
Exhibit 2 presents each of the subject assets and the valuation method(s) that were applied to estimate their fair market value.
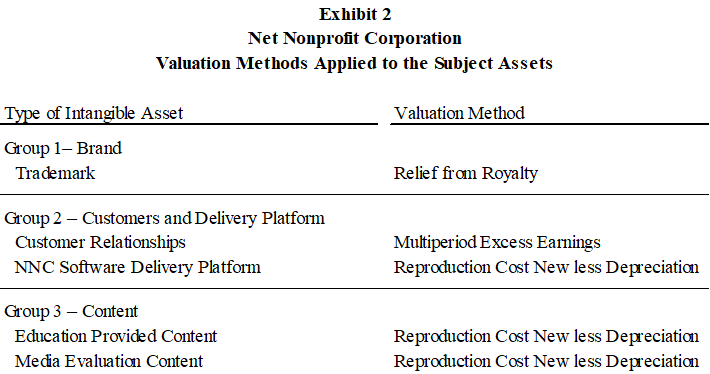
In order to estimate the fair market value of the NNC trademark, the relief from royalty method was used in conjunction with the CUT method. The CUT method was used to identify arm’s-length license transactions that supported the selection of an arm’s-length royalty rate. The arm’s-length royalty rate was used in the relief from royalty method to estimate the fair market value of the NNC trademark.
The multi-period excess earnings method (MPEEM) was used to estimate the fair market value of the consumer customer relationships. Since NNC’s customers are end-users and since the intangible asset relied upon to generate customer revenue is the ratings and reviews content, the MPEEM is the most appropriate valuation method to apply to the customer relationships.
The reproduction cost new less depreciation (RCNLD) was used to value the existing NNC software network delivery platform (the delivery platform) and all content intangible assets. Since these assets do not directly generate revenue, the Cost Approach, and specifically the RCNLD, is the most appropriate valuation method to value these intangible assets.
The Search for Guideline Publicly Traded Companies
In order to perform the MPEEM and RCNLD methods, it was necessary to perform a search for guideline publicly traded companies. The purpose of the search was to identify guideline publicly traded companies to use as financial for-profit type benchmarks. Because NNC is a nonprofit organization, its financial statements, its financial ratios, and its business structure do not resemble a for-profit business. For the purpose of this hypothetical example, it is assumed that the most likely market for the subject assets is a market comprised of for-profit business entities.
From the perspective of a for-profit business, the for-profit buyer: (1) would prefer to pay a price less than fair market value, (2) is unwilling to pay a price greater than fair market value, but (3) is typically willing to pay a price equal to fair market value. Similarly, the for-profit seller: (1) would prefer to sell at a price higher than fair market value, (2) is unwilling to sell at a price less than fair market value, but (3) is typically willing to sell at a price equal to fair market value.
Guideline Publicly Traded Companies
The searched for guideline publicly traded companies focused on companies that bear similarities to NNC in terms of market and industry competition, risk, and expected returns; and that own and operate assets in the same or similar lines of business.
The first step in the search for guideline publicly traded companies is the determination of the appropriate Standard Industrial Classification (SIC) code. The following SIC codes were considered in the search for NNC guideline publicly traded companies:
- SIC code 2700—Printing, publishing, and allied industries
- SIC code 2731—Book publishing
- SIC code 7370—Computer programming, data processing, and other computer-related services
- SIC code 7372—Prepackaged software
- SIC code 7375—Information retrieval services
- SIC code 8200—Educational services
- SIC code 8299—Schools and educational services
Although many of NNC’s direct competitors are privately held, companies were identified that provide products and services that require similar skills and expertise, have similar end-users, and provide many similar products and services. In addition, the companies which were identified are subject to similar risk factors that affect NNC’s business operations. However, because NNC business operations are very unique and because NNC is a nonprofit company, the identified companies provide only general guidance on market and industry investment risk, profitability, and expected return.
Based on descriptions provided by the Capital IQ database, the following six publicly traded companies were selected to be used as guideline publicly traded companies:
- Cambium Learning Group, Inc.
- Houghton Mifflin Harcourt Company
- Yelp Inc.
- Sasbadi Holdings Berhad
- K12 Inc.
- 3P Learning Limited
These guideline companies were used to establish for-profit business benchmarks. Benchmarks were used for the purpose of estimate NNC asset values. These guideline companies were also used to prepare a reasonableness check as a method to test the reasonable of the NNC intangible asset valuation analysis.
Group 1—Brand (Trademark Analysis)
The NNC trademark analysis is based on the relief from royalty method and the CUT method.
This relief from royalty method is based on the principle that an intangible asset operator/licensee would be willing to pay the intangible asset owner for the right to use the intangible asset. Since NNC owns its trademark, they are relieved from having to pay a royalty to license the trademark from a third-party licensor.
For this trademark analysis example, to estimate (1) the arm’s-length royalty rate associated with the subject trademark and (2) the fair market value of a trademark, it is generally recommended to follow certain procedures, such as:
- Discuss the use of the trademark with Company management.
- Research guideline arm’s-length licensed CUTs to use in the analysis.
- Estimate the arm’s-length, market-based royalty rate for the subject based on the CUTs.
- Estimate the required rate of return for the subject trademark using the guideline publicly traded company financial benchmark analysis.
- Apply the relief from royalty method to provide an indication of fair market value for the subject trademark.
- Apply an amortization income tax shield benefit related to the potential income tax savings from the tax amortization based on the value of the subject trademark that a for-profit buyer would enjoy.
For this example, nine arm’s-length trademark license transactions, were considered in order to select an arm’s-length royalty rate. Based on these nine license transactions, certain statistics were calculated including the mean, median, low, and high indications. Statistical calculations were prepared for two groups: (a) the low end of the royalty rate indications and (b) the high end of the royalty rate indications.
Exhibit 3 presents the nine CUT transactions and corresponding statistical calculations.
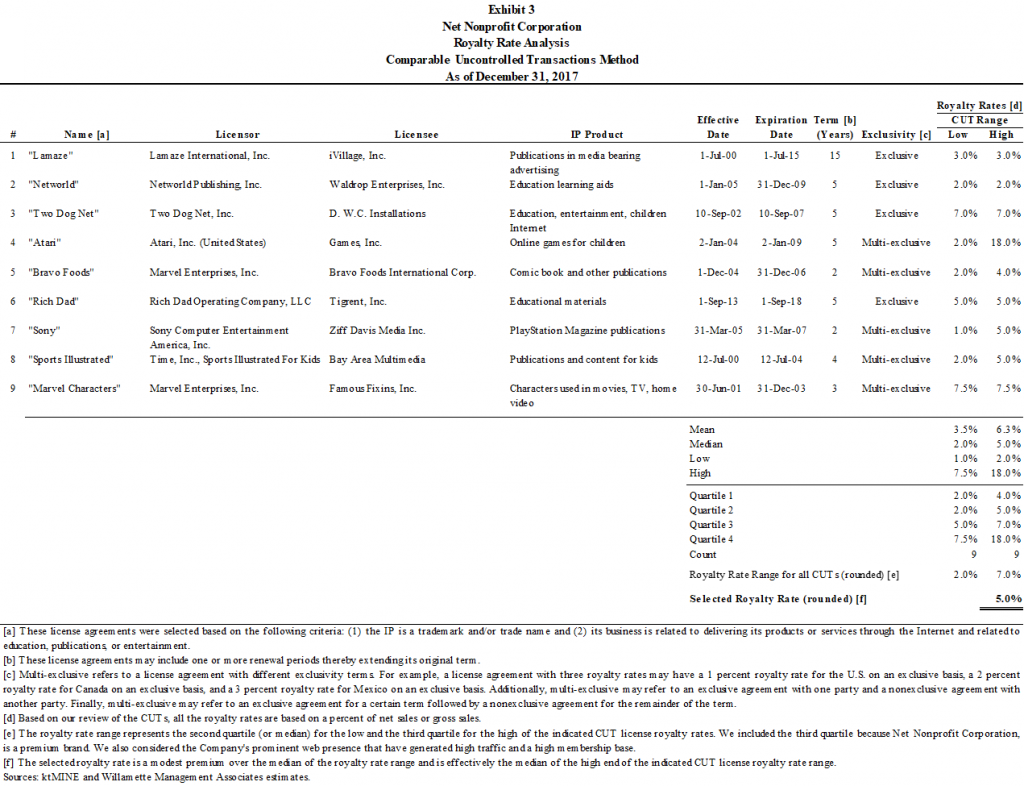
As presented in Exhibit 3, the mean and median of the low end of the royalty rate range were 3.5 percent and 2.0 percent, respectively. The mean and median of the high end of the royalty rate range were 6.3 percent and 5.0 percent, respectively.
The interquartile range statistical analysis of the nine CUTs was also calculated. The interquartile statistical analysis results were used to support selection of the relevant arm’s-length royalty rate.[4] The interquartile range on the low end of the royalty rate range was 2.0 percent and 5.0 percent, respectively. The interquartile range on the high range of the royalty rate range was 4.0 percent and 7.0 percent, respectively.
Using the various arm’s-length license transactions, an indicated range of arm’s-length royalty rates of 2.0 percent and 7.0 percent was identified. The low end of the indicated range, or 2.0 percent, is the median (or the second quartile) of the low end of the royalty rate range. The high end of the indicated range, or 7.0 percent, is the third quartile (or high end of the interquartile range) of the high end of the royalty rate range.
For this example, an arm’s-length royalty rate of 5.0 percent was selected. This represents a premium to the midpoint of the indicated royalty rate range.[5] This also represents the median of the high end of the royalty rate range. In selecting the arm’s-length royalty rate of 5.0 percent, it was considered that, according to NNC management, the NNC brand is highly regarded in the scientific education market and considered a premium name. The selection also considered that the Company’s prominent and growing web presence is due, based on discussions with NNC management, to its successful search engine optimization techniques that have generated a high level of internet traffic and, consequently, a high membership base.
Because NNC’s scientific journal review product offerings are generally available to the public and to educators, and because of the high quality of its website and the user experience, the NNC trademark enjoys wide exposure and acceptance in the educational products space. The selected arm’s-length royalty rate recognizes this valuable intangible quality of the NNC trademark.
According to Company management, the NNC trademark intangible asset is expected to continue to exist and yield economic benefits indefinitely. Therefore, the estimated remaining economic useful life (RUL) of the NNC trademark is indefinite as of the valuation date and, therefore, is valued in perpetuity.
Since the NNC trademark was used in all areas of the NNC business, the selected royalty rate of 5.0 percent was applied to the NNC projected total revenue in order to estimate pretax income attributable to the NNC trademark for each year of the projection period.
Next, in order to estimate the value to a hypothetical for-profit buyer, the annual pretax royalty savings was adjusted for income taxes and then discounted the after-tax savings to a present value using a present value discount rate. The present value discount rate reflects the risks inherent in the NNC business overall and in the trademark intangible asset.
In the second and third articles of this series, the author details how to calculate the present value discount, how to arrive at the fair value of trademarks and customer relationships, and how to test the reasonableness of the conclusions.
This article was previously published in, Willamette Insights, Spring 2019, titled “Fair Market Value Valuations of Not-for Profit Entity Property Transfers”, and is republished here with permission.
Kevin M. Zanni, ASA, CVA, CBA, CFE, CEIV, is a Managing Director at Willamette Management Associates in the firm’s Chicago office. He provides taxation valuation opinions, litigation valuation and damages opinions, fair value valuation opinions, transactional fairness opinions, and solvency opinions. He is the past president of the Chicago Chapter of the American Society of Appraiser and the current president of the Business Valuation Association of Chicago.
Mr. Zanni can be contacted at (773) 399-4333 or by e-mail to kmzanni@willamette.com.
[1] https://www.upcounsel.com/types-of-nonprofits, accessed January 28, 2019.
[2] https://www.irs.gov/charities-non-profits/charitable-organizations/exemption-requirements-section-501c3-organizations, accessed January 28, 2019.
[3] The Uniform Standards of Professional Appraisal Practice (USPAP) 2018–2019 edition, defines a hypothetical condition as follows: a condition, directly related to a specific assignment, which is contrary to what is known by the appraiser to exist on the effective date of the assignment results, but is used for the purpose of analysis. USPAP page 4.
[4] The interquartile range is between the 25th percentile, or the first quartile, and the 75th percentile, or the third quartile.
[5] The midpoint of 2.0 percent and 7.0 percent interquartile range, the selected indicated royalty rate range, is 4.5 percent.