A Deeper Inquiry to Better Understand Risk and Performance
Key performance indicators (KPIs) can provide business valuation better insight regarding the risk profile of the company, revenue drivers, forecasts, and performance of management in the market served. In this article, the author provides insight regarding what metrics are potentially available to better understand a firm that is being valued.

When performing a business valuation analysis, one essential consideration is understanding the subject company’s revenue drivers. Looking at the company’s top-line revenues, a growth or a decline rate is clearly visible. Throughout the valuation engagement, a valuation professional may inquire about what contributed to the company’s revenue growth or decline during the management interview. If it is a one-to-two-year spike and/or valley in revenues, typically, a business owner can point out the event that triggered steep growth or decline. It could be a one-time contract or losing one major client, etc. However, what is frequently lacking is a breakdown of components that contribute to the company’s year-over-year growth or decline. To accomplish this, consideration should be given to understanding the company’s revenue drivers and key performance indicators (KPIs).
The company’s revenue drivers and KPIs are essential elements that contribute to the company’s value and reveal risk factors and prospects. Revenue drivers and KPIs vary based on the industry in which the subject company operates. For example, for an insurance business, some of the revenue drivers may include:
- Net premium growth;
- Renewal rates;
- Sales conversion rates;
- Policy persistency or retention rate; and
- Loss ratio, etc.
For a restaurant business, some of the revenue drivers may include:
- Average check size metrics;
- Average item price;
- Customer traffic metrics;
- Sales and revenue;
- Table turnover rate;
- Menu offering and mix of products/menu items;
- Labor cost ratio, etc.
For a start-up technology company, some of the revenue drivers may include the following:
- Customer acquisition cost;
- Customer conversion rate;
- Customer lifetime value;
- The average revenue per user/client;
- Active users/clients, usage frequency, etc.
A deeper dive into the company’s revenue drivers and KPIs allows the valuation professional to assess the company’s historical performance better, determine the risk profile, and project prospects.
When evaluating the company’s revenue drivers and KPIs from a historical context, a valuation professional can pinpoint and assess the subject company’s ability to generate revenues, control or manage its costs, and achieve its strategic targets. In addition, the valuation professional can use the company’s revenue and KPI metrics and compare them to the industry standards or the company’s peer group.
By way of an example, one of the core revenue metrics for a restaurant business is the average revenue per available seat hour (ARASH), also known as revenue per available seat hour (RevPASH). ARASH or RevPASH metric offers valuable insights into the restaurant’s efficiency in utilizing its seating capacity, thereby revealing its ability to generate revenue.
Let’s assume we are reviewing a casual dining restaurant with 50 seats and we want to compare the restaurant’s ARASH to industry standards. If the owner tracks the number of hours the seats are available for dining (excluding non-operational hours), we can calculate the total revenue generated during operational hours and divide it by the total number of available seat hours.
- If the restaurant generates $10,000 in revenue during 200 available seat hours in a month, the ARASH would be:
- ARASH = Total Revenue / Available Seat Hours
- ARASH = $10,000 / 200 = $50 per available seat hour
To compare this metric to industry standards, we can research industry reports and publications or consult with restaurant associations to gather benchmark data for similar types of restaurants in the subject market area.
For instance, if the industry average ARASH for similar casual dining restaurants (in the subject area) is $40 per available seat hour, our hypothetical client’s restaurant’s ARASH of $50 would indicate that their revenue generation per seat hour is better than the industry average. However, it should be noted that to compare this metric to industry standards, a valuation professional should account for the type of restaurant, its location, and various other market dynamics.
Let us review another example, utilizing one of the revenue-driving metrics for a home health agency. Home health agencies rely on their referral network to grow their business. This network may include primary care physicians, insurance companies, or third-party referral sites. Therefore, a referral conversion rate (RC) is an essential metric to track. This metric measures the percentage of referrals received by the agency and how many referrals actually convert into patients or clients. RC offers insights into the agency’s ability to convert potential referrals into revenue-generating clients. If a home health agency receives 100 referrals from various sources, such as hospitals, physicians, and community organizations, within a specific period, and out of those referrals, 70 become actual patients, the subject agency’s referral conversion rate would be 70%. According to one source, an average home health agency has an RC of 50%. This suggests that the subject agency converts referrals into the company’s patients or client base more effectively than the industry average. However, it should be noted that industry benchmarks may vary widely based on the agency’s location, market area, demographic, and other factors.
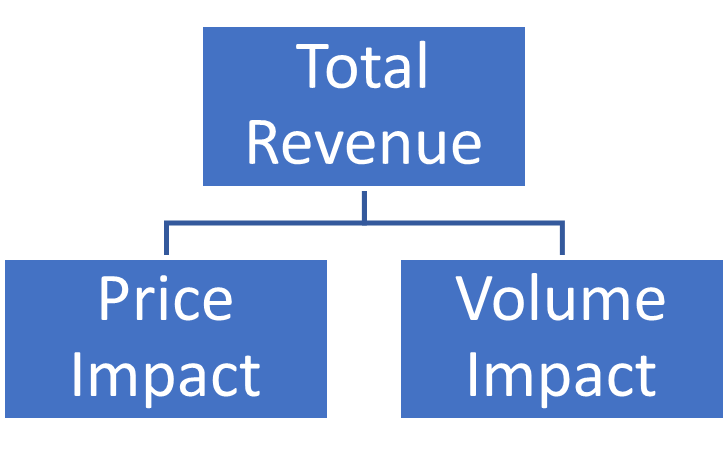
For companies that provide a mix of products and services, rate-volume analysis can be used as a helpful tool to determine whether the company’s volume or increase in rates (prices) contributes to the company’s revenue growth or decline. Rate-volume analysis is a quantitative framework that examines the relationship between the company’s revenue, pricing strategies, and sales volume. Changes in any of these underlying factors may significantly impact, favorably or unfavorably, the company’s future performance.
The following formulas can be used to perform a rate-volume analysis. To calculate the rate impact, we take the difference (variance) in the current rate vs. base rate (can be vs. budget or prior period, etc.) and multiply it by the actual (current year) volume.
- Rate
(Actual Rate – Base Rate) x Actual Volume = Rate Variance
To calculate the volume impact, we multiply the difference (variance) in current volume vs. base volume (can be vs. budget or a prior period, etc.) by the base rate.
- Volume
(Actual Volume – Base Volume) x Base Rate = Volume Variance
Let’s review a numerical example:
- In FY1, the company’s revenue was $750,000
- The company sold 6,000 units at $125 per unit
- In FY2, the company’s revenue was $1,056,000
- The company sold 8,000 at $132 per unit
We can see that the company’s revenue increased by $306,000, or 41%, compared to the prior year. Was this growth attributable to the company selling more units or its price increase?
The illustration below presents the rate-volume analysis for this example:
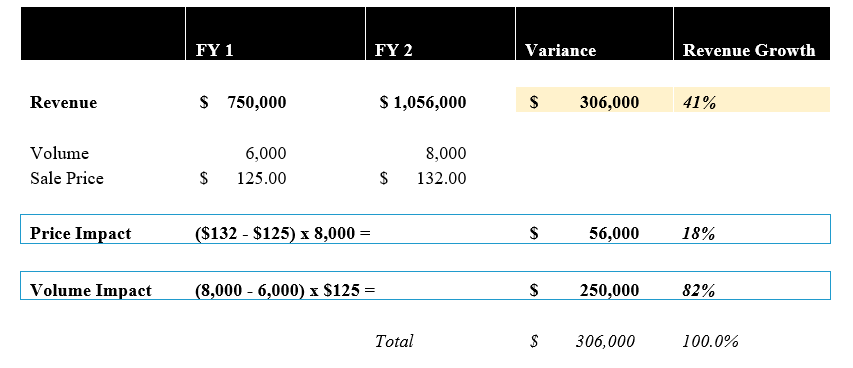
From this analysis, we can see that the revenue growth was primarily driven by an increase in volume. It accounted for approximately 82% of the impact.
The rate-volume analysis framework is useful for business valuation professionals for a number of reasons. First, it gives a valuation professional insight into the company’s revenue-generating capabilities, which is essential in facilitating the development of credible and reliable forecasts. Second, this type of analysis is also helpful in analyzing the company’s pricing power and, therefore, the subject company’s ability to generate higher revenue from its products and services.
We can extend the rate-volume analysis further by allocating the impact of the volume by incorporating the impact of the product/service mix, as illustrated next.
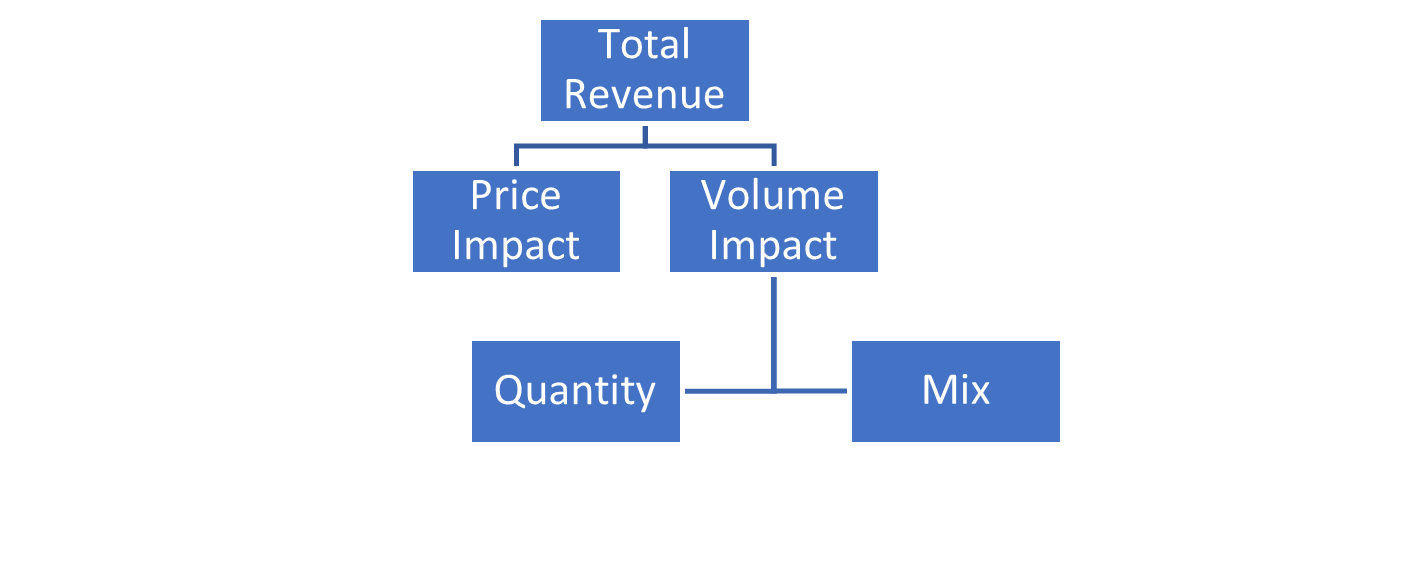
Mix refers to the effect of altering the proportions of different products or services vs. the total quantity sold. When several products (or service lines) have different pricing levels, adjusting the relative quantities of these products over time can lead to changes in revenue.
Let us review a numerical example.
Suppose a company sells various products, including shoes, dresses, bags, etc. The company made $4.8 million in the first year and sold 30,000 product units. The company earned $9.5 million in the second year and sold 44,700 product units. Please see the illustrations below for details.
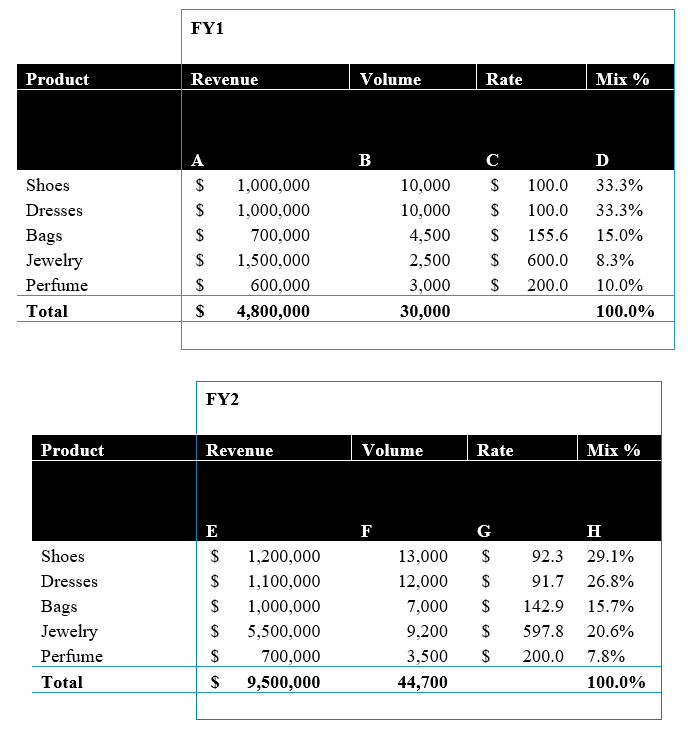
The company’s revenues increased by $4.7 million from year one to year two. We can see that the impact of price was negative. The volume effect can further be broken down into the quantity sold and the product mix. Based on the illustration below, we can see that the jewelry product mix was primarily responsible for the impact on the company’s change in revenue from year one to year two.
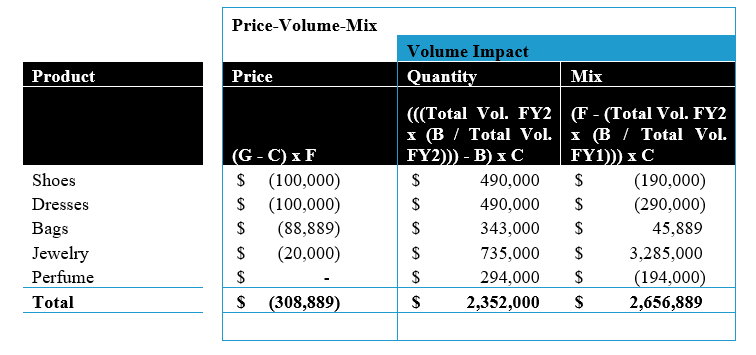
The effect of product/service mix can help to explain the differences in the company’s margins and sales. If the company sells products with higher profit margins, overall revenues will increase and vice versa.
The rate-volume-mix analysis, along with understanding the company KPIs and value drivers, is essential for forecasting and business valuation due to its significant impact on revenue generation and understanding the underlying drivers of financial performance. Furthermore, this analysis allows for a comprehensive evaluation of a company’s economic performance. Analysts and valuation professionals can determine the underlying factors driving revenue fluctuations by isolating the impacts of rate, volume, and mix changes. This evaluation aids in assessing operational efficiency, identifying areas for improvement, and tracking the effectiveness of strategic decisions.
Finally, the rate-volume-mix analysis facilitates scenario analysis, enabling valuation professionals to explore the potential impact of different rate, volume, and mix scenarios on future revenue and business valuation. An analyst can assess the potential outcomes and risks associated with different strategic decisions or market conditions by modeling various scenarios, such as price changes, market share shifts, or product mix adjustments. Valuation professionals can use these types of analytical tools to navigate uncertainties, make informed decisions, and stay ahead in a dynamic and ever-changing environment.
Nataliya Kalava CVA, ABV, MAFF, is the founder and managing director of American Valuations. She has over 12 years of experience in the field of finance. Ms. Kalava has prepared, overseen, or contributed to hundreds of valuations for purposes related to gift and estate tax planning, management planning, transaction (M&A), SBA valuations, financial reporting, and litigation, among others. She greatly enjoys working with business owners to address ownership transition challenges and opportunities. Ms. Kalava is the co-founder and managing member at NAMBRI Technologies LLC www.nambri.com and she serves on the Board of Directors for the Business Transition Council of Tampa Bay, a not-for-profit organization https://btctampa.com.
Ms. Kalava can be contacted at (813) 999-1144 or by e-mail to nataliya@amervalue.com.