Ensuring Accurate Valuations with Real-World Testing
One of the key assumptions valuation professionals must make is about a company’s capital structure. This article explores factors valuation professionals should consider as they arrive at the debt and equity used to value the entity.

Business valuation and financial modeling involve navigating a wide range of assumptions, and for the resulting values produced by these models to be truly meaningful, these assumptions need to be well-grounded. One of the key assumptions valuation professionals must make is about a company’s capital structure. This term refers to the specific mix of debt and equity a company uses to fund its operations and growth, and it plays a critical role in calculating the weighted average cost of capital (WACC). WACC is a financial metric that measures the average cost of capital for both debt and equity holders. The WACC formula is: WACC = (Debt %) x (Cost of Debt Capital) + (Equity %) x (Cost of Equity Capital). The cost of debt capital reflects the interest rate a company would pay to secure debt, while the cost of equity represents the return expected by shareholders. The proportions of debt and equity influence the company’s overall capital structure.
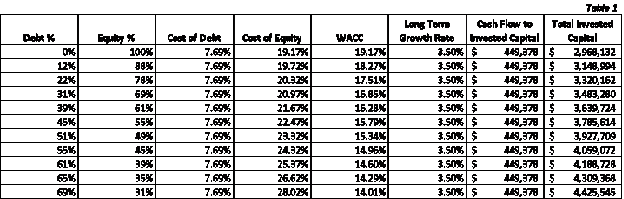
The capital structure assumptions play a crucial role in a company’s valuation. As demonstrated in Table 1 below, changes in capital structure can significantly affect the WACC, which in turn impacts the company’s overall value. For instance, if the WACC ranges from 19.17% to 14.01%, depending on the capital structure, this variation leads to a notable difference in the market value of invested capital, with values ranging from approximately $2.9 million to $4.4 million; a difference of $1.5 million. Such a significant difference can have a considerable impact on financial decisions, including the amount a partner might receive in a buyout, the sale price for retirement, or the loan amount a company can obtain. This illustrates how vital the capital structure assumption is to the valuation process; as it has real and considerable implications for companies, their financial decisions, and for their owners.
Determining a company’s capital structure often involves using industry standard ratios or benchmarks from comparable public companies. According to FASB ASC 820 on Fair Value Measurement, it is advisable to consider a market participant’s capital structure when calculating the WACC. While it might be straightforward to pick industry ratios and apply them to the subject company, it is worth asking, “Does this approach make practical sense?” It is essential to evaluate whether the company can realistically support and maintain the capital structure assumptions we are applying. Understanding the true implications of the capital structure helps ensure that the selected ratios are not just theoretical but also achievable and sustainable for the company in the real world.
A reasonableness check can be performed using key financial ratios to determine if the industry-standard capital structure is appropriate for a company. These ratios help evaluate whether the assumed level of debt is manageable given the company’s cash flows. One such ratio is the debt service coverage ratio (DSCR), which measures the company’s ability to meet its total debt service obligations, including both interest and principal repayments. It is calculated as: Debt Service Coverage Ratio = Net Operating Income/ Total Debt Service. In this formula, net operating income refers to the income generated from operations, and total debt service includes both interest and principal repayments. As a rule of thumb, most lenders require a DSCR of at least 1.25x. If the company meets or exceeds this benchmark, it indicates a reasonable ability to cover its debt obligations.
Another important ratio is the interest coverage ratio (ICR), which assesses the company’s ability to pay interest on its outstanding debt. It is calculated as: Interest Coverage Ratio = EBIT/ Interest Expense. A higher ratio signifies a better ability to manage interest payments. While a ratio of at least three is generally considered healthy, this will vary by industry. To fine-tune an analysis, refer to industry reports to find the appropriate benchmark for the sector.
Using these ratios, we can evaluate if the industry-standard capital structure aligns with the company’s financial realities, ensuring the debt levels are theoretically sound and practically sustainable. Let’s put our reasonableness check to the test with an illustrative example using Betty’s Bakery. We will evaluate the capital structure assumption used in the WACC calculation for the valuation of Betty’s Bakery by examining the DSCR and ICR.
Betty’s Bakery has been in operation for over 30 years. Betty started the business from scratch and grew it into a wildly successful business; famous throughout the region for its cupcakes. With three bustling locations, Betty is now ready to retire and sell her bakery. Que the business valuation professional. We step in to perform this valuation for sale purposes. After conducting our due diligence, we determined that the capitalization of earnings method is the most suitable approach. Following normalization adjustments and other necessary steps, we calculate a cash flow to invested capital of $449,378 for Betty’s Bakery. Next, we develop a WACC using an after-tax cost of debt of 8.69%, a cost of equity of 24.32%, and selecting the industry-standard capital structure of 55% debt and 45% equity. This results in a WACC of 15.72%. With a long-term growth rate of 3.5%, the after-tax capitalization rate is approximately 12.22% (see Table 2 for details).

Using the capitalization of earnings method, we calculate the market value of invested capital for Betty’s Bakery to be $3,806,105. After subtracting the bakery’s interest-bearing debt balance of $221,858, we arrive at a fair market value of equity of $3,584,247.

I would be quite satisfied with that number if I were in Betty’s shoes. But let’s continue to test our assumptions to ensure we provide Betty with an accurate assessment of her business’s value. After all, we do not want to undervalue her bakery and cause her to miss out on well-deserved return on investment or overvalue it and have it sit on the market longer than necessary, leading to the headache of price cuts.
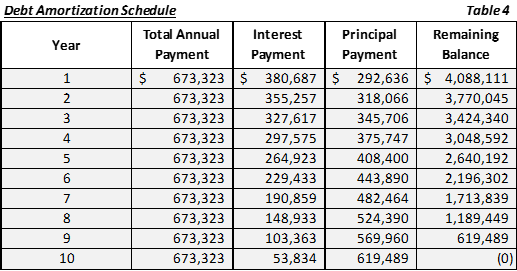
First, let’s look at what we are implying with our capital structure assumption. We have selected an industry-standard capital structure of 55% debt and 45% equity for Betty’s Bakery on a forward-looking basis. Given the equity value of $3,584,247, as determined by the capitalization of earnings method, we can calculate the assumed debt for the company using the formula: Debt = (Equity / Equity %) – Equity. This results in an estimated debt of $4,380,747. Therefore, our forward-looking capital structure assumes approximately $3.5 million in equity and $4.3 million in debt. The real question is whether Betty’s Bakery can realistically maintain and support this level of debt. We will test this with the DSCR and ICR. To do this, we will first have to determine the annual cost of debt assumed by this capital structure. Using a debt amortization schedule with an average term of 10 years, an interest rate of 8.69%, and a principal debt balance of $4,380,747, we find that the annual loan payment would be approximately $673,323. In the first year of loan repayment, $292,636 of the payment will be applied to the principal balance, while $380,687 will go towards interest. This is illustrated in Table 4 below.
The bakery’s forecasted net operating income is $642,880. This results in a DSCR of 0.95x, calculated as $642,880 divided by the annual debt service of $673,323. The bakery’s resulting DSCR falls short of the SBA guidance of 1.25x, indicating that the bakery’s net operating income is insufficient to cover this level of debt repayment.
We will also evaluate the ICR. With the bakery’s EBIT at $581,778 and an interest payment of $380,687, the ICR comes out to 1.53x. This is below industry standards, further corroborating that this level of debt cannot realistically be supported by Betty’s Bakery. Therefore, it would be wise to reconsider this assumption.
After following the standard procedures to determine the capital structure, we found that the industry benchmark did not quite fit with the financial position of the subject company. So, what is the next step? An alternative approach is to use the company’s actual fair market value of debt and equity to determine the capital structure. We will assume that the company’s current debt represents the target/optimal amount because it reflects management’s strategic decisions regarding leverage, risk tolerance, and growth objectives. Typically, the market value of debt can be approximated by the debt balance on the company’s balance sheet; as the book value generally does not deviate too much from the fair market value. However, the same approach does not work for equity. The book value of equity often differs significantly from its fair market value because the balance sheet does not recognize the current market value of the assets or the inclusion of any intangible assets, such as goodwill. Here, we encounter a problem, we need the fair market value of equity to determine our capital structure, but we do not know the value of equity until we solve for it; resulting in a circular dependency. Fortunately, Excel’s Goal Seek function offers a solution. Goal Seek is a function that helps to determine the required input value needed to achieve a targeted output value.
Let’s apply this to Betty’s Bakery. We begin by recreating the WACC, using the company’s market value of debt, which is $221,858. Since we are solving for the fair market value of equity, we will start with a placeholder value—let’s say $1,000,000—this will serve as our input value in Goal Seek. Combined with the debt, this gives us a total invested capital (TIC) of $1,221,858. Using the same cost of debt, cost of equity, and long-term sustainable growth rate as before, we calculate a WACC of 21.48% and a capitalization rate of 17.98%, see Table 5 for details. With cash flows to TIC at $449,378, we calculate a TIC value of $2,586,796. Subtracting the debt gives an equity value of $2,364,938. Here is where we notice a discrepancy, the TIC and equity values used in the WACC calculation do not equal those derived from the income approach. This discrepancy indicates that the equity value used in our placeholder assumption does not reflect the company’s true fair market value of equity.
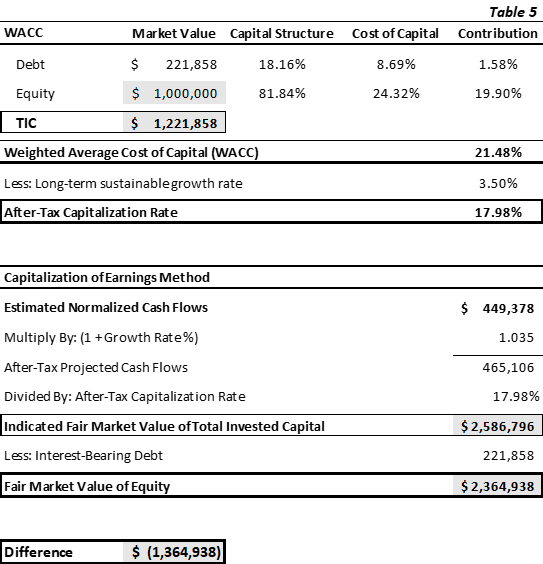
To resolve this discrepancy, we first calculate the difference between the two TIC values, which is $1,364,938. This difference represents the target output value, which we will aim to reduce to zero, as eliminating this difference would mean that the debt and equity used in the WACC calculation match those derived from the income approach. Now that we have our input value (placeholder equity) and our target output value (difference between TIC), we can turn to Goal Seek. Here is how to use it:
- In Excel, go to Data, then What-If Analysis, and select Goal Seek.
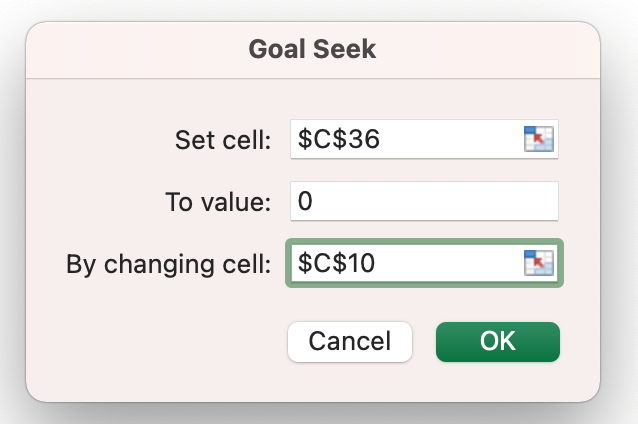
- Set the “Set Cell” to the cell calculating the difference between the two TIC values. In our example, this is the cell with the value of $(1,364,938).
- Set the “To Value” to zero.
- For “By Changing Cell,” select the placeholder equity cell used to calculate the WACC. In our example, this is the cell with the value of $1,000,000.
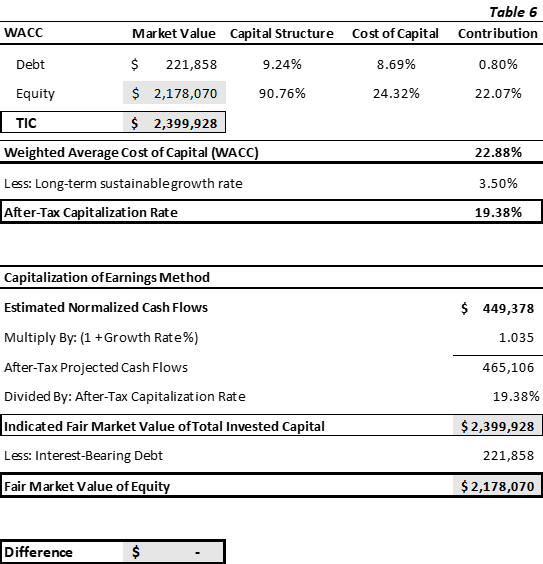
Click “OK,” and Goal Seek will adjust the placeholder equity value so that the TIC from the capitalization of earnings method aligns with the TIC used in the WACC, making the difference between the two TIC values zero. After running Goal Seek, we arrive at a capital structure of 9.24% debt and 90.76% equity for Betty’s Bakery. This results in a WACC of 22.88%, a capitalization rate of 19.38%, and a fair market value of equity of $2,178,070, as illustrated in Table 6.
When we compare the outcome of using the industry standard capital structure versus the company’s actual capital structure, we can see how significantly this assumption affects the valuation of Betty’s Bakery. Initially, using the industry-standard capital structure, the company’s value was estimated at $3,584,247; about a $1.4 million difference from the value derived using the company-specific capital structure. This provides a more accurate figure that will allow her to price her business competitively when selling. Using an appropriate capital structure, the WACC now accurately reflects the true risk of Betty’s Bakery’s cash flows, and we arrive at a reasonable valuation. Betty can now confidently plan her retirement, knowing she has a realistic valuation for her bakery.
As we have seen with Betty’s Bakery, relying solely on industry-standard ratios can lead to assumptions that may not align with a company’s financial reality. By carefully evaluating these assumptions and using tools like Excel’s Goal Seek, we can ensure that the capital structure is not only theoretically sound but also practically sustainable.
Brianna Solito, CVA, is the Valuation Services Manager at ONE10 Advisors. She has valued various companies ranging from small businesses to large corporations for purposes related to gift and estate tax planning, sale, litigation, and SBA financing purposes. These valuations span across several industries, including but not limited to: construction services, manufacturing, professional services companies, and retail businesses.
Ms. Solito can be contacted at (863) 513-9861 or by e-mail to bmcknown@ONE10Firm.com.