Did Your Expert Use Correlation Analysis?
Businesses Incur Expenses In Order to Generate Sales. Understanding How These Different Variables Relate to Each Other is Important. Here are Some Tips.
Often experts present opinions based on statistical analysis. It helps to understand some basic statistical tools.  Dave Sutherland discusses some tools used to test for relationships that may exist among data sets, such as sales, marketing, cost of goods sold, etc.  Here’s why correlation may not always be evidence of causation. 
Your expert may present opinions based on statistical analysis.  While you will not need to become an expert on statistical analysis, it is helpful if you understand some basic statistical tools.  One such tool is Correlation Analysis.
There are a variety of tools to test for relationships that may exist among data sets, such as sales, cost of goods sold, etc. ¬†Think back to the time when your client emphatically proclaimed, ‚ÄúSales would have gone up, because we‚Äôve been spending a ton on advertising!‚ÄĚ ¬†This is an interesting statement. ¬†The client assumes that there is a causal relationship between how much they spend on advertising and sales. ¬†The assumption is that the more they spend on advertising, the more their sales increase. ¬†This may be true, but it may not.
Businesses incur expenses in order to generate sales.  Understanding how these different variables relate to one another is important.  In fact, if a relationship exists, predictions can be made.  Experts try to visualize, describe, and quantify these relationships.
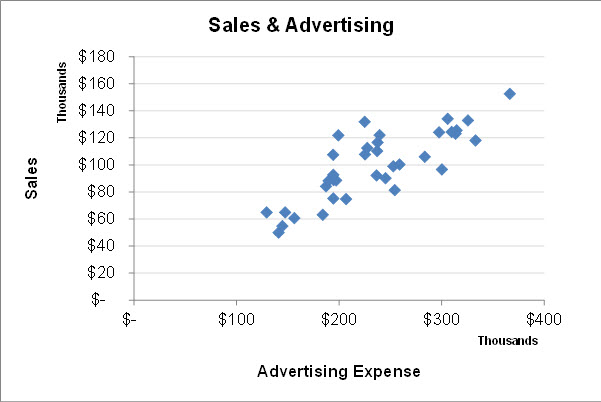
One of the simplest ways to visualize the strength of the relationship between two variables, such as sales and advertising costs, is to create a graph.
This type of graphical representation shows each variable relative to the other.  As is evident in this example, the data points are relatively close together and are upward-sloping.  Visually, it appears that both sales and advertising expense are related; however, what the picture does not show is the strength of the relationship.
One way to quantify the strength of the relationship between the two variables is to determine the ‚Äúsample correlation coefficient‚ÄĚ. ¬†The sample correlation coefficient is a statistic that measures the strength of the relationship. ¬†In our example, it is the strength of the relationship between sales and advertising expenses. ¬†The measurement will lie somewhere between ‚Äú-1‚ÄĚ and ‚Äú1.‚Ä̬†
An amount close to zero implies a great deal of randomness or that the variables are not related. In our example, the sample correlation coefficient is equal to ‚Äú0.814‚ÄĚ (n=36).1 An amount close to ‚Äú1‚ÄĚ implies a ‚Äústrong positive correlation.‚ÄĚ ¬†In other words, as advertising expense increases, sales increase as well. ¬†Conversely, an amount close to ‚Äú-1‚ÄĚ is said to possess a ‚Äúnegative correlation‚ÄĚ or as advertising expense increases, sales likely decrease.2
It is not enough to establish that the relationship is positive, negative, or no correlation.  The expert needs to identify how significant the relationship is between the two analyzed variables.  A significance test proves mathematically that the results did not occur by chance. Your expert should determine whether to either accept or reject a hypothesis that zero correlation exists between sales and advertising expense.  In our example, we would reject the hypothesis that there is zero correlation between the two variables.3  In other words, sales and advertising expense are have a strong correlation and are statistically significant.
Statistical analysis performed properly can be very powerful.  Performed poorly, it can be disastrous.
Dave Sutherland is a Certified Public Accountant, Certified Fraud Examiner, and a Certified Law Enforcement Auditor.¬† He has been involved in criminal and civil investigations since 2002 and has been in practice for three years.¬† He is a Manager at Epps Forensic Consulting PLLC specializing in financial investigations, forensic accounting, litigation support, fraud examination, and law enforcement consulting services.¬† Dave co-teaches with Joe Epps on the topic of White Collar Crime investigations through Rio Salado Community College.¬† He also teaches Financial Forensics in Law Enforcement (FFLE¬ģ) a two-day training program for law enforcement officers.¬† For more information, please call (480) 595-0943 or visit www.eppsforensics.com.
1 The sample correlation coefficient was calculated using MS Excel‚Äôs built-in formula ‚Äú=CORREL(range1, range2)‚ÄĚ.
2 Doane, D. & Seward, L. (2011).  Applied Statistics in Business & Economics (3rd Edition).  New York, NY:  The McGraw-Hill Companies, Inc.; pg. 490.
3 Correlation determined between the two variables by calculating the t-statistic, which is the test for zero correlation.¬† Based on the information and documentation, we measure correlation between sales and advertising expense.¬† This determination is based on a two-tailed test for significance of 0.05 at 34 degrees of freedom (The Hypothesis are: H0¬†: p = 0; ¬†H1¬†: p¬†‚Ȇ 0).¬† In this case, we calculated the t-statistic to be equal to 8.169. This amount is greater than the critical values of ¬Ī2.032, under the following decision rule:
Reject H0 if > 8.169 > 2.032 or if 8.169 < -2.223
Based on the foregoing, we must reject the hypothesis that there is zero correlation between the two variables. Taking this analysis a step further, we calculate a two-tailed ŌĀ-value of 1.57671E-09, which is < 0 (reject H0 = 0, if p < 0).


