60-Second Method
Ascertaining the Financial Status of a Business in a Few Quick Glances
The 60-Second Method is a system of ascertaining the financial status of a business or other entity in a few quick glances. It is a training tool that can be used to demonstrate how financial analysis works, or instruct decision-makers beginning to read and understand financial statement content.
[su_pullquote align=”right”]Resources:
Fundamentals of Understanding Financial Information
Financial Statements—Written Confessions
Advanced Financial Statement Analysis—Case Studies
Financial Statement Analysis, Economic, and Industry Overview
[/su_pullquote]
Summary
The 60-Second Method is a system of ascertaining the financial status of a business or other entity in a few quick glances. It is a training tool that can be used to demonstrate how financial analysis works, or instruct decision-makers beginning to read and understand financial statement content.
It will likely take longer than “60” seconds to learn the technique.  However, as the name implies, it permits evaluation of a company’s financial strengths and weaknesses in a relatively short period of time. The method can also be employed when attempting to discuss financial matters with non-financial professionals such as attorneys and clients. It is very basic, yet informative. The authors have demonstrated the technique to hundreds, perhaps thousands, of people during the last 15 years or so.
Foundation of Method
There are three essential financial statements when using the 60-Second Method:
- Balance Sheet
- Income Statement
- Cash Flow Statement
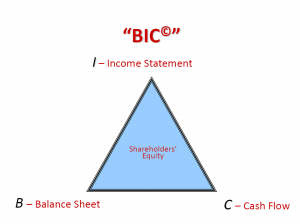
Each statement is vital to the process and can be easily remembered with the acronym “BIC©” (yes, like the pen) as illustrated by Exhibit 1.
Exhibit 1
Â
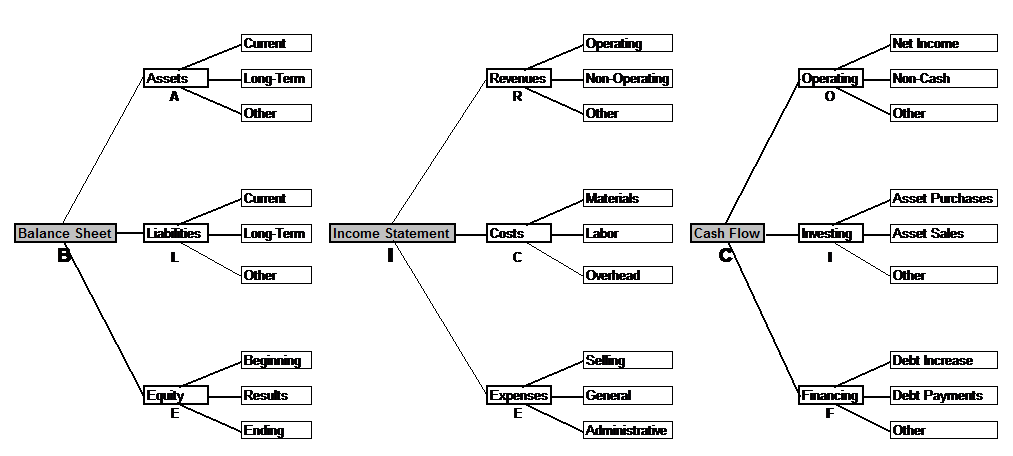
Each of the three statements has three main components and each of those, likewise, has three subcategories as displayed in the following tree diagram (Exhibit 2):
Exhibit 2
Application
The application of the 60-Second Method begins with understanding the three financial statements and the major components that comprise each one. This structure supports the application of the method and assessing the results. The application of the method involves analyzing the changes in each financial statement’s main component subcategories. Simply, did the amount increase or decrease (e.g., year two compared to year one) and is that good or bad?
Balance Sheet
The balance sheet reflects a company’s assets, liabilities, and shareholder’s equity. The amounts are reported as of a specific date. Often, the date will be as of the year or month end. It is called a balance sheet because the assets of a company will always equal or balance with the combination of the company’s liabilities and shareholder’s equity.
Assets are reported on the balance sheet based on how quickly they could be converted to cash if sold. Although a real balance sheet typically has more subcategories, the three general groups are:
- Current—assets that the company expects to convert to cash within one year. Examples include cash, accounts receivable, and inventory.
- Long-term—assets that the company does not expect to convert to cash within one year. Examples include equipment, machinery, and leasehold improvements.
- Other—assets that would not typically fit in another category. Examples include goodwill and intangible assets.
Liabilities
Liabilities are reported on the balance sheet based on when owed or to be paid. Although a real balance sheet would have more subcategories, the three general groups are:
- Current—assets that the company expects to pay within one year. Examples include accounts payable and accrued vacation.
- Long-term—assets that the company does not expect to pay within one year. Examples include equipment loans.
- Other—liabilities that would not typically fit in another category.
Equity
Equity is the amount that was initially invested in the company and its accumulated yearly financial results, whether positive or negative. Although a real balance sheet typically has more subcategories, the three general groups are:
- Beginning—the ending retained earnings (shareholder equity) amount from the prior period.
- Results—the company’s earnings or losses for the period.
- Ending—the combination of beginning retained earnings (shareholder equity) and the current period results.
60-Second Method Application to the Balance Sheet
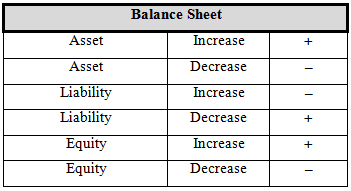
Once the major components and subcomponents are identified, changes to the account balances are assessed. A system of “+” and “–” is used to denote a favorable or adverse change, respectively. Exhibit 3 summarizes how to assess the changes in the balance sheet amounts.
Exhibit 3
Assets are assessed in the following order:
- Total assets
- Current assets
- Long-term assets
- Other assets
Exhibit 4 illustrates the application of the 60-Second Method to the asset section of a balance sheet.
Exhibit 4
Assessing the results from period 12/31/X1 to 12/31/X2:
- Total assets decreased, denoting a “–” or adverse change.
- Current assets decreased, denoting a “–” or adverse change.
- Long-term assets increased, denoting a “+” or favorable change.
- Other assets decreased, denoting a “–” or adverse change.
Liabilities
Liabilities are assessed in the following order:
- Total liabilities
- Current liabilities
- Long-term liabilities
- Other liabilities
Exhibit 5 illustrates the application of the 60-Second Method to the liabilities section of a balance sheet.
Exhibit 5
Assessing the results from period 12/31/X1 to 12/31/X2:
- Total liabilities increased, denoting a “–” or adverse change.
- Current liabilities increased, denoting a “–” or adverse change.
- Long-term liabilities increased, denoting a “–” or adverse change.
- Other liabilities decreased, denoting a “+” or favorable change.
Equity
Equity is assessed in the following order:
- Ending retained earnings
- Beginning retained earnings
- Results from business activity (net income or loss)
Exhibit 6 illustrates the application of the 60-Second Method to the shareholder equity section of a balance sheet.
Exhibit 6
Assessing the results from period 12/31/X1 to 12/31/X2:
- Ending retained earnings decreased, denoting a “–” or adverse change.
- Beginning retained earnings increased, denoting a “+” or favorable change.
- Results from business activity decreased, denoting a “–” or adverse change.
Income Statement
The income statement reflects how much a company earned or lost over a specific period. Often, the period will be a year or month. It is called an income statement because it eventually reports the company’s overall income as net profit or loss for the period.
Revenue is reported first on the income statement and represents the total amount of money a company brings in from their operations. Although a genuine income statement will have more subcategories, the three general groups are:
- Operating—all money received from normal business operations.
- Non-operating—all money received from non-business operations (i.e., rental income).
- Other—money received that would not typically fit in another category (i.e., interest income).
Costs
Cost of goods sold is generally reported next on the income statement and is deducted from total revenues. Costs include all amounts paid in order to produce the product or service sold. Generally, the three subcategories of costs[1] are:
- Materials—supplies, raw materials, and parts used.
- Labor—employee labor and labor costs directly incurred.
- Overhead—the portion of company overhead that is allocated to production.
Expenses
Expenses are all other amounts paid to support the general operation of the business. This would include items such as advertising, rent, insurance, and office expenses. The three main groups of expenses are:
- Selling—amounts incurred to sell the business product or service.
- General—amounts paid for the general business operation.
- Administrative—amounts incurred to direct and control the business operation.
60-Second Method Application to the Income Statement
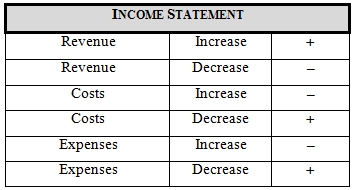
Once the major components and subcomponents are identified, changes to the account totals are assessed. A system of “+” and “–” is used to denote a favorable or adverse change, respectively. Exhibit 7 summarizes how to assess the changes in the income statement amounts.
Exhibit 7
Revenue is assessed in the following order:
- Operating income
- Non-operating income
- Other income
Exhibit 8 illustrates the application of the 60-Second Method to the revenue section of an income statement.
Exhibit 8
Assessing the results from year 12/31/X1 to 12/31/X2:
- Operating income decreased, denoting a “–” or adverse change.
- Non-operating income increased, denoting a “+” or favorable change.
- Other income decreased, denoting a “–” or adverse change.
Costs
Costs of goods sold are assessed in the following order:
- Materials
- Labor
- Overhead
Exhibit 9 illustrates the application of the 60-Second Method to the costs of goods sold section of an income statement.
Exhibit 9
Assessing the results from year 12/31/X1 to 12/31/X2:
- Materials purchased increased, denoting a “–” or adverse change.
- Labor costs increased, denoting a “–” or adverse change.
- Overhead decreased, denoting a “+” or favorable change.
Expenses
Expenses are assessed in the following order:
- Selling expenses
- General expenses
- Administrative expenses
Exhibit 10 illustrates the application of the 60-Second Method to the expenses section of an income statement.
Exhibit 10
Assessing the results from year 12/31/X1 to 12/31/X2:
- Selling expenses decreased, denoting a “+” or favorable change.
- General expenses increased, denoting a “–” or adverse change.
- Administrative expenses decreased, denoting a “+” or favorable change.
Cash Flow Statement
The cash flow statement reflects a company’s inflows and outflows of cash over a specific period. Often, the period will be for a year or month. The cash flow statement will reveal where the cash came from or went to, i.e., cash generated from the sales of product or bank financing.
Cash flow from Operating activities is generally the profit or loss reported on the income statement adjusted for any noncash items that were included. Although some cash flow statements would have more subcategories, the three general groups are:
- Profit (loss)—the amount reported on the income statement.
- Depreciation—any amount included on the income statement.
- Working capital—changes in working capital balances on the balance sheet, i.e., accounts receivable and accounts payable.
Investing
Cash flow from investing activities generally includes amounts for financial investing, i.e., securities, but also includes investments in the company such as the purchase or sales of machinery or land. Generally, the three subcategories of investing are:
- Operating assets—assets used for operations.
- Marketable securities—investments with financial institutions, stocks, or bonds.
- Fixed assets—property, buildings, and equipment.
Financing
Cash flow from financing activities generally includes bank borrowing or loan repayment amounts. It also includes funds received from or paid to owners. The three main groups of expenses are:
- Borrowing—amounts received from bank loans.
- Repayment—amounts paid to repay outstanding bank loans.
- Distributions—amounts paid to shareholders.
60-Second Method Application to the Cash Flow Statement
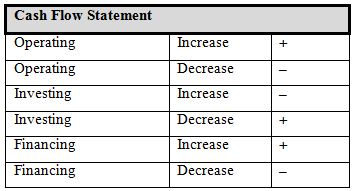
Once the major components and subcomponents are identified, changes to the cash flow statement totals are assessed. A system of “+” and “–” is used to denote a favorable or adverse change, respectively. Exhibit 11 summarizes how to assess the changes in the cash flow statement amounts.
Exhibit 11
Operating cash flow is assessed in the following order:
- Net income
- Non-cash operating activities
- Other operating activities
Exhibit 12 illustrates the application of the 60-Second Method to the operating section of a cash flow statement.
Exhibit 12
Assessing the results for the period 12/31/X1 to 12/31/X2:
- Profit (loss) from operating activities decreased, denoting a “–” or adverse change.
- Depreciation increased, denoting a “+” or favorable change.
- Working capital flow increased, denoting a “+” or favorable change.
Investing
Investing cash flow is assessed in the following order:
- Asset purchases
- Asset sales
- Other investing
Exhibit 13 illustrates the application of the 60-Second Method to the investing section of a cash flow statement.
Exhibit 13
Assessing the results from year 12/31/X1 to 12/31/X2:
- Operating assets cash flow decreased, denoting a “+” or favorable change.
- Market securities cash flow increased, denoting a “–” or adverse change.
- Fixed assets cash flow decreased, denoting a “+” or favorable change.
Financing
Financing cash flow is assessed in the following order:
- Debt increase
- Debt payments
- Other financing activities
Exhibit 14 illustrates the application of the 60-Second Method to the financing section of a cash flow statement.
Exhibit 14
Assessing the results from year 12/31/X1 to 12/31/X2:
- Borrowed debt increased, denoting a “+” or favorable change.
- Repayment of debt decreased, denoting a “–” or adverse change.
- Distributions to shareholders decreased, denoting a “+” or favorable change.
Conclusion
The 60-Second Method quickly assesses financial statement components as favorable or adverse. In general, the assessment applies to almost any commercial, noncommercial, nonprofit, or government operation and accurately measures financial performance. However, it is important to note that occasionally an assessment results in a flawed conclusion of a company’s financial position. For example, the 60-Second Method for a start-up business would likely produce an adverse assessment of the company’s investing cash flow. However, it is not unusual for a new company to purchase assets to begin business operations, thus creating an outflow of cash. When using this method, it is imperative that the forensic operator consider the results and then investigate specific variances as necessary.
Excerpt of Financial Forensics Body of Knowledge ISBN-13: 978-0470880852– Co-Authored with Gregory A. Gadawski, John Wiley & Sons, Inc., New York, with accompanying Internet site 2012.
[1] In a service business, no inventory, per se, is reported. However, the “cost” to generate the revenue is equal to the labor and overhead expended generated throughout.
Darrell D. Dorrell is a forensic accountant specializing in the determination, investigation, restatement, analysis, interpretation, forecasting, feasibility, translation, and visualization of complex financial and operational data.
He is a partner in a highly specialized forensic accounting practice, financialforensics® based in Lake Oswego (Portland), OR. The practice serves clients in many states throughout the U.S. His experience includes more than 35 years of very complex and highly specialized financial guidance for a wide variety of businesses and industries ranging from Fortune 500 through one-person operations.
Mr. Dorrell can be contacted at (503) 636-7999 or by e-mail to darrelld@financialforensics.com.
Mr. Gregory A. Gadawski is Principal of Financial Forensics. Mr. Gadawski’s forensic accounting, litigation, and business valuation related experience includes a variety of complex matters. His expertise encompasses a wide scope of industries, including professional service organizations, brokerages, financial services, construction, retail, utilities, municipalities, not-for-profits, manufacturing, and many others.
Mr. Gadawski can be reached at GregG@financialforensics.com.


