Return on Invested Capital and Growth: M&A Multiple Drivers
Ron Stacey considers Return on Invested Capital (ROIC) and growth using EBITDA as a proxy for cash flow. ROIC, Stacey writes, is a critical value driver that’s probably the single most important factor for a given cost of capital. But calculation is never simple: “People always want a formula, but it doesn’t work that way,” Warren Buffet once noted. “You have to estimate total cash generated from now to eternity, and discount it back to today.” Here’s a case study. Find out how ROIC works—and what drives it.
Operating companies employ invested capital to generate a return. The capital is invested in operating assets, typically working capital and fixed assets. These assets are financed with interest-bearing debt and equity referred to as the invested capital. The return earned on this investment is the return on invested capital (ROIC) for the operating business. In this short article, we take a look at ROIC and growth using EBITDA (earnings before interest, taxes, depreciation, and amortization) as a proxy for cash flow.
Return on invested capital, (ROIC) is a critical value driver (we contend the single most important factor for a given cost of capital) because businesses that produce more cash flow per dollar of investment (capital utilization) at the same risk level (cost of capital) are, well, worth more! Moreover, companies with a high ROIC have a lower reinvestment rate since less of the EBITDA needs be invested to support growth; hence, more of the EBITDA is available for distribution. Known as the reinvestment rate, the math entails dividing the growth rate by the ROIC to find the percentage of EBITDA reinvested to support growth.
To the extent the ROIC exceeds the cost of capital, the business creates value, and the faster it grows, the more value it creates. A business that has a ROIC that is less than the cost of capital destroys value, and the faster it grows, the more value it destroys. A business that creates value commands a higher multiple for a given cost of capital.
As to revenue, growth, and margins, improved margins generally translate to improve ROIC— provided the invested capital remains constant—save for reinvestment requirements. Margins must be improved to the point where the ROIC exceeds the cost of capital in order to create value. Revenue growth is generally not the best way to improve margins except possibly in certain manufacturing situations where fixed costs are high; then again, high, fixed-cost industries (bad economics) can suffer brutal price competition (margin erosion), particularly when overall demand is low.
The following examples demonstrate the relationship between multiples and the key value drivers: ROIC and growth. The supporting tables employ a discounted net EBITDA analysis with a 15-year discrete period and a default to three percent growth thereafter into perpetuity to determine a continuing value. For the latter calculation, the reinvestment rate is computed using the three percent long-term growth assumption. EBITDA margins and ROIC are the same in order to keep the math simple. Our hypothetical example companies are Southwest Widget and Midwest Gadget.
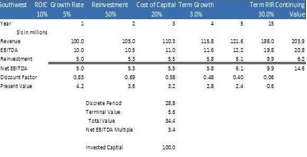
Southwest Widget (“SW”) invests $100 million in a new plant that produces an EBITDA of $10 million on revenues of $100 million, which are expected to grow at five percent annually; the return on invested capital for the new plant is 10 percent. If the cost of capital for SW is 20 percent (remember the five times), then SW has a value less than the value of its invested capital. The table below illustrates the SW situation:
The resulting $34.4 million EBITDA derived value is less than the invested capital at $100 million. Since SW is not earning its cost of capital, the faster it grows, the less it’s worth. This deal is not going to happen with a 20 percent cost of capital and a 10 percent ROIC.
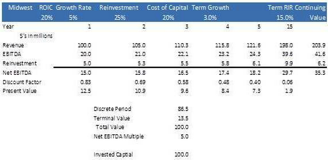
Midwest Gadget (“MG”), on the other hand, builds a new plant for $100 million that earns $20 million in EBITDA; the return on invested capital is 20percent, which is equal to the cost of capital and the value is equal to the invested capital; growth has no impact on value since MG earns exactly its cost of capital. In this case, the multiple is five as shown in the following table.
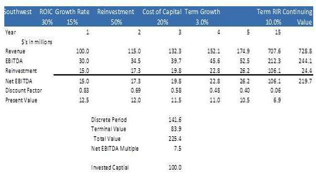
In a third scenario, assume SW is able to improve its ROIC to 30percent, 10 percent more than the cost of capital, and is able to grow at 15 percent per year. The difference in value is dramatic as indicated below:
The multiple under this scenario is 7.5! Note that the total value is now $225.4 million on that same invested capital of $100 million. High ROIC in high growth situations is the ideal combination for driving value.
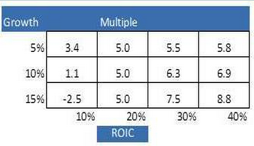
We put this idea of ROIC, cost of capital and growth together in the next table developed for a 20 percent (that five again) cost of capital under different growth and ROIC assumptions. As in the above examples, each scenario runs for 15 years and then defaults to a 3 percent long-term growth rate thereafter.
Â
In the first column, the ROIC is less than the cost of capital. Increasing the growth simply destroys value and lowers the multiple even further to a theoretical negative 2.5. In this situation, the ROIC needs to be fixed before any attempts at growth are undertaken. We call this under-performing scenario “the turnaround,” and it rarely gets a five, particularly if both the ROIC and growth need to be improved. This scenario is ideal for distressed investors and turnaround types.
In the second column, the company is earning the cost of capital; the ROIC and cost of capital are the same at 20 percent. In this situation, a higher growth rate neither creates nor destroys value; it simply adds more zeros to the absolute numbers. So here is that magic five multiple appearing in every box, suggesting that many middle market companies valued at a five multiple are expected to earn at the EBITDA level the cost of capital at 20 percent, nothing more, nothing less. Since ROIC is not expected to be any better in the future than it has been in the past, that magic five is typically applied to the “trailing” twelve month EBITDA; a buyer’s convention to start the bidding at a price that reflects no benefit for growth or improved ROIC though synergies. Smart sell-side investment bankers armed with the knowledge herein can effectively negotiate up from five, particularly in high-growth situations where the buyer is able to reduce costs through synergies and increase the ROIC.
The real exciting columns are the third and forth columns where the value is driven by an expected ROIC greater than the cost of capital, and the more it grows, the better it gets. These outcomes dramatically demonstrate the power of the primary multiple drivers, ROIC and growth.
While these numbers work out mathematically, it’s only fair to say that in an M&A context ROIC, growth and cost of capital are in the eye of the beholder, the specific buyer. Not all buyers are created equal, which is why sell-side investment bankers engage in price discovery via the auction process at the EBITDA level using multiples. For example, a buyer that can reduce cost through synergies (increase ROIC), or provide distribution channels that can accelerate growth (increase revenue on increased margin), has advantages over other bidders and can price justify a higher offer. The mission of the sell-side investment banker is finding that right buyer, or the best new owner, and capturing as much as possible of the value added from synergies through the careful execution of the auction process for the benefit of the seller.
What Drives Return on Invested Capital?
At this point, you may be asking: “What drives ROIC?” The short answer is the competitive behavior of the industry and any single player’s ability to achieve sustainable competitive advantage. Thirty years ago, Harvard Business School professor Michael Porter popularized the notion of sustainable competitive advantage in his seminal work, Competitive Strategy. Porter’s framework includes the four forces of competition: barriers to entry, threat of substitution, buyer power, and supplier power.
A fifth and highly important element identified by Porter is the degree of industry rivalry or the industry “economics.” High ROIC industries tend to be those with attractive industry structures like branded consumer goods, pharmaceuticals, and software IT. Low ROIC industries have less attractive economics, such as airlines, utilities and integrated telecom. Management in low return industries can be successful, relative to their peers, but the challenge is daunting. We quote from Warren Buffet: “When management with a reputation for brilliance tackles a business with a reputation for bad economics, it is the reputation of the business that remains intact.”
While Porter identified three generic strategies, (differentiation, low cost producer, and focus) we translate these into four groups: intangible assets, switching costs, the network effect and cost advantage. A full discussion of sustainable competitive advantage is beyond the scope of this article, but we have provided references in the end notes for further reading.
Improvements in ROIC are achievable even in industries with difficult economics. Take, for example, the case of John Deere. In 1995, Deere directed the focus of the organization to ROIC by changing the compensation system for managers. By leveraging the brand and the dealer network through a focus on ROIC, Deer’s ROIC increased from under 10 percent to over 40 percent recently. Share price tripled.
Summary
The magic five multiple is a point of departure for cost of capital typically applied to the purchase of a middle market business. As illustrated in this article, a transaction that occurs at a five multiple is one that is expected to earn the 20 percent cost of capital no more, no less. The real drivers of multiples are ROIC and growth, but only if the ROIC exceeds the cost of capital. Multiples occurring in excess of five are for high-ROIC, high-growth business and at less than five for turnarounds.ROIC is a function of industry economics and sustainable competitive advantage. Across the deal spectrum from small to large, larger companies command higher multiples because the risk is less and the cost of capital is less. For the smaller companies, the converse is true. Our aim here is to shed light on the origins of that magic five and hopefully we made some progress in that regard.
We leave you with one last quote from Warren Buffet: “People always want a formula, but it doesn’t work that way. You have to estimate total cash generated from now to eternity, and discount it back to today. Yardsticks such as P/Es are not enough by themselves.”Â
Ron Stacey is the Founder and a Managing Director at Legacy Advisors, a Dallas-based boutique investment bank. Please contact him at rstacey@legacyadvisors.org or call (214) 705-1112 with comments or to request copies of Excel spreadsheets used in this article.


