
The Superiority of Regression Analysis over Ratio Analysis
Accuracy is everything
This article provides an overview of the significance of regression analysis in business valuations, with a particular emphasis when applying the Market Approach. The theory is presented as to why regression analysis is superior to ratio analysis.

The Superiority of Regression Analysis over Ratio Analysis
Let’s assume a business appraiser is engaged by an attorney to calculate the fair market value (FMV) of a company for litigation purposes. One of the valuation approaches applied is the Market Approach. The common valuator calculates various average multiples from the sample data such as the mean or median price-to-gross sales or price-to-earnings to determine the FMV of the subject company. However, the appraiser has no information how reliable and accurate this average multiple really is. If the attorney would ask him or her about the error rate, the appraiser would not have an answer.
However, the appraiser should know the error rate since this is one of the four Daubert criteria.1
The four Daubert criteria for evaluating the admissibility of expert testimony are:
- Whether the methods upon which the testimony is based are centered upon a testable hypothesis
- The known or potential rate of error associated with the method
- Whether the method has been subject to peer review
- Whether the method is generally accepted in the relevant scientific community
The error rate is the “known or potential rate of error” associated with using the particular scientific technique. Most scientists generally require that this error rate be very small, usually between one and five percent.
The error rate is crucial in evaluating the scientific validity. If a scientist reports that he rejected a hypothesis without stating the level of confidence at which it was rejected, such a scientist has not much credibility. Indeed, such a report would be completely meaningless.
How do we calculate the error rate? How do we form a confidence interval? How do we even know whether our results are statistically significant? The answer to these questions can be summarized with two words: Regression Analysis.
The regression analysis is an advanced sophisticated statistical technique that can be used to calculate the FMV of a business or business interest. It measures the mathematical relationship between a dependent variable and one or more independent variables, such as selling price and revenues.
To better illustrate this: Think about a scatter plot with many points scattered in it. The goal of the linear regression is to fit a line through these points so that the squared deviations of the observed points from that line are minimized. That’s why this is also referred to as Ordinary Least Squares Regression (OLS) Estimation.
Regression for Business Valuation
In business valuation, typically we are trying to measure economic dependent variables like FMV, selling price, sales, etc. Below is a list of typical dependent and potentially related independent variables.
|
Data Source |
Dependent Variables |
Independent Variables |
|
IBA Market Data |
Selling Price |
Gross revenue, discretionary cash flow, geographic location |
|
Pratt’s Stats |
Selling Price |
Same, plus net income, book value, growth rates in sales or profitability, stock vs. asset sale, etc. |
|
PubliclyTraded Stocks |
Mkt Cap. |
Same plus perhaps more |
|
Subject Company |
Sales history |
Measures of national income (GNP, GDP), relevant commodity prices (e.g., gold prices for jewelry stores) |
Time Series and Cross-Sectional Analysis
There are two types of regression analysis: time series and cross-sectional analysis variables. In time series analysis, we are trying to measure the effect of the passage of time on one company’s data, e.g., its history of sales. Time series analysis comprises methods that attempt to understand such time series, often either to understand the underlying theory of the data points (Where did they come from? What generated them?), or to make forecasts (predictions).
Cross-sectional analysis studies the relationship between different variables at a point in time, for instance, the relationship between income, locality, and expenses. Unlike time series, cross-sectional analysis relates to how variables affect each other at the same time.
Figure 1 shows a cross-sectional regression in a scatter plot with costs and expenses as a function of sales.
Figure 1: Costs & Expenses as a Function of Revenues
($000’s)
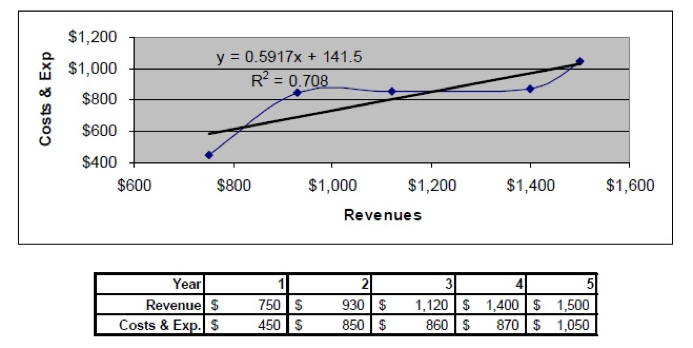
It makes sense that as sales rise, cost of sales and expenses rise. The regression equation of a cross-sectional analysis has the following look:
[A1] COS Exp = a + (b × Sales)
The x-coefficient b is the variable costs of the business. It is our statistical estimate that answers the question for every $1.00 increase in sales; how do costs and expenses increase? A typical value for b is $0.00 to $.99. If b equals $1.00, the business makes nothing on each new sale, and if it is greater than $1.00, the business loses money on each sale.
Now let’s look at the y-intercept, a. What does it mean? It is the regression’s estimate of fixed costs, i.e., what are the costs and expenses the business must undertake just to open its doors—even if it sells nothing. Typical components of fixed costs are rent, salaries of top management, depreciation on machinery, etc.
Why is regression analysis more accurate than ratio analysis?
Ratio analysis calculates ratios of a dependent variable to independent variables that are “valuation drivers”, i.e., variables that investors would consider in how much they would pay for the guideline companies, such as sales, earnings, and cash flow, etc.
Appraisers typically calculate the mean or median price/sales or price/earnings multiples. The mean and the median reflect measures of central tendency. These are proxies for the most probably observation in a data set. The mean is the arithmetic average of the data set, but means can be skewed dramatically by outliers. The median is the middle of a distribution: half the scores are above the median and half are below the median. The median is less sensitive to extreme scores than the mean and this makes it a better measure than the mean for highly skewed distributions. However, medians have less reliability as the size of a data set decreases.
In developing a mathematical relationship between FMV and the valuation drivers, regression analysis is far superior to valuation ratios whenever possible for several reasons.
- It provides the specific mathematical relationship between FMV and one or more valuation drivers. This is the x-coefficient(s) of the independent variable(s). Ratio analysis is limited to one variable at a time, while regression analysis can work with all variables simultaneously, which is a big advantage.
- It provides objective measurement of the strength of the explanatory power of the independent variables, measured by R2. The R2 measures the percentage reduction in the forecast error compared to using the mean of the dependent variable. Thus, an R2 of 90 percent would mean that variation in the guideline company independent variables explains 90 percent of their variation in FMV (the dependent variable) compared to using the average FMV of the guideline companies.
- It measures the statistical significance of the independent variables with the p-value. This enables us to judge how likely it is that the relationship of the independent variable to FMV is a mistake due to random variation. The p-value measures the probability that the true and unobservable x-coefficient is zero (or of the opposite sign). The smaller this probability, the more robust is our result. It is standard procedure to accept as statistically significant all variables for which p ≤ 5 percent, and many authorities routinely accept the statistical significance if p ≤ 10 percent and reject variables for which p > 10 percent.
- It calculates the standard error, which measures the accuracy of the regression estimate. The larger the standard error, the less sure we can be about the regression equation’s ability to forecast the dependent variable. An approximate 95 percent confidence interval can be formed by doubling the standard error. In other words, we can be approximately 95 percent sure that the true value of the dependent variable = ± 2 × standard error.
In summary, regression analysis provides us with additional and relevant information about the sample data. The regression results will tell us how reliable the data is and whether it has any statistical significance. Regression analysis produces less forecasting error than average multiples because it is based on the least squares regression, which leads to the least forecast error.
Regression analysis is not just useful in calculating the FMV and the error rate, which is the end part of the analysis. We can also use it very efficiently in the first part of the analysis, which is the elimination process of the observations. The “standardized residual” is a sophisticated statistical tool to identify and remove heavy outliers in the sample scientifically. Those outliers could be the result of data entry errors. The standardized residual is standardized according to a t-distribution. A standardized residual of three for example would mean that the observation is three standard deviations above or below the mean, which could be considered to be an outlier.
In reference to Daubert, the Court of Appeals affirmed the rule that expert opinion based on a scientific technique is inadmissible unless the technique is generally accepted as reliable in the relevant scientific community.2
Stephen Mahle, JD, PhD, a Daubert expert, states in his article “Econometric Issues in Business Litigation Expert Testimony3”, that regression, done properly, qualifies under Daubert.
Conclusion
The regression analysis does a superior job of explaining the sample than the multiples. We recommend the regression analysis in addition to the ratio analysis. This way, the appraiser will know how reliable the database really is and how meaningful the multiples really are. This information is necessary and critical to give the correct weighting to the market approach in the reconciliation of FMV.
As far as the error rate is concerned, the regression analysis is not only able to calculate it, but has less forecasting error than the mean or median multiples. Moreover, a regression analysis acts as a sanity check that will surely bolster the appraisal report considerably.
This article was originally published by and appears on the website of U.S. Valuations and is used here with permission.
Daniel Jordan, CPA, ASA, CBA, MBA, is the managing principal of New York Business Valuation Group, Inc. He is an expert in valuing closely-held businesses, ESOPs, fractional interest discounts, intangible assets, and professional practices incl. calculations of enhanced earnings capacity relating to professional licenses and degrees. He provides business valuation services full time since 2000 and can be reached at (212) 203-5186 or djordan@usvaluations.net.
1 “An Introduction to Daubert v. Merrell Dow.” http://www.daubertexpert.com/basics_daubert-v-merrell-dow.html
2 Daubert v. Merrell Dow Pharmaceuticls (92-102), 509 U.S. 578 (1993). http://straylight.law.cornell.edu/supct/html/92-102.ZS.html
3 Mahle, Steven. “Econometric Issues in Business Litigation Expert Testimony. DaubertExpert.com http://www.daubertexpert.com/econometric.html#1legaview.html.
Related posts
-

From Forecast to Flawed Assumptions and a Speculative Basis
-

Price Isn’t Right
-

Accounting Expert Witness Reliably Calculates the Quantum of Monetary Harm
-

The Intersection of Advocacy and Financial Forensics
-

Multispecialty Surveys for Physician Compensation Released
-

Expert Testimonies in The Trade Group, Inc. v. BTC Media, LL
-

Understanding IPCPL Theory, Evidence, and Application
-

Challenges to Expert Witnesses Under New Rule of Evidence 702
