
One Explanation for the Variance in the Price/EBITDA Multiple
Given a Fixed Amount of EBITDA
After reading Steve Egna’s article in the April 12, 2017 issue of QuickRead Buzz, in which he suggests that a larger multiple of EBITDA is realized as the number of employees of the selling business increases, the author considered testing whether that same approach could help explain why a certain amount of EBITDA would generate multiple amounts of MVIC. In this article, the author shares his findings.

[su_pullquote align=”right”]Resources:
EBITDA Single Period Income Capitalization for Business Valuation
The Use of Regression Analysis to Calculate Multipliers in the Market Approach
The Use of Regression Analysis in the Market Approach
[/su_pullquote]
After reading Steve Egna’s thought provoking article in the April 12, 2017 issue of QuickRead Buzz, in which he suggests that a larger multiple of earnings before interest, tax, depreciation, and amortization (EBITDA) is realized as the number of employees of the selling business increases, I considered that the same approach could help explain why a certain amount of EBITDA would generate multiple amounts of market value of invested capital (MVIC). This can readily be observed in a scatterplot of MVIC vs EBITDA with a trend line showing average selling prices for any particular amount of EBITDA.
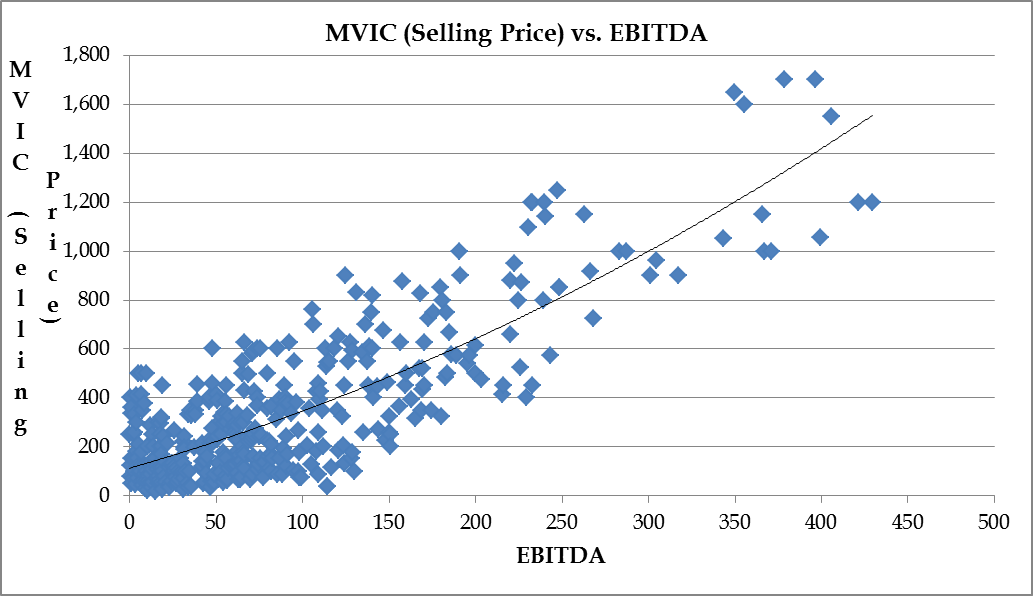
What one notices immediately is that while the trend line bifurcates the selling prices for any amount of EBITDA, what remains is the fact that about half of the selling prices are above the trend line and about half are below the trend line such that we can observe a range of Price/EBITDA multiples from one to eight. This is true for any amount of EBITDA and raises the question as to why this phenomenon exists—what can be driving this much degree of variability in the multiples?
One possible answer suggested by Steve Egna is that the number of employees in a business might make that business less dependent on the owner, thereby decreasing personal goodwill and increasing corporate goodwill, thus making the business more attractive to buyers and consequently demanding a higher multiple than similarly situated businesses. I therefore proceeded to replicate what Steve had done and expand the process to test my idea.
First, I downloaded 2,018 transactions from Pratt’s Stats that had the three-digit NAICS prefix 541 and then sorted on the “MVIC to EBITDA” multiple and found 1,193 transactions with a positive EBITDA, thus eliminating 825 transaction that had no or negative EBITDA. I sorted again, this time on “Number of Employees” and found 599 transactions with employee size ranging from zero to 3,700. This eliminated another 594 transactions.
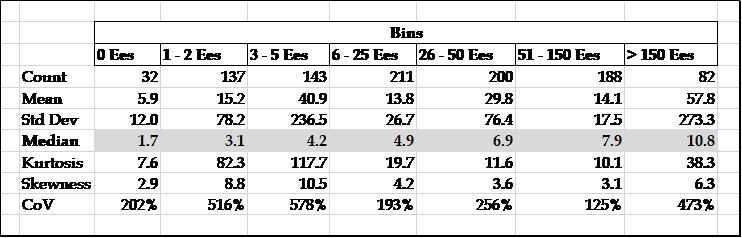
Next, I created seven bins, or categories, based on number of employees as follows:
0, 1–2, 3–5, 6–25, 26–50, 51–150, >150 and sorted the 599 MVIC/EBITDA multiples into the appropriate bin based on number of employees. I then ran a Kruskal-Wallis test to see if at least two of the medians were not equal. The test suggested that, with a p-value of zero, that at least two of the medians were unequal. The test could not tell us which two, but it did provide average ranks for the seven bins that showed ever increasing averages as the number of employees grew. This result was consistent with the median MVIC/EBITDA multiples for each of the seven bins, as they too grew succeeding larger with the number of employees.
I then ran Mann-Whitney Rank Tests comparing each succeeding set of two bins to test if the median multiple of each of those bins was statistically significantly different from the median multiple of its paired bin. Thus, I compared the 0 bin with the 1-2 bin, and the 1-2 bin with the 3-5 bin, etc. to see if the medians were different from each other. I found that some of the bins did not have enough transactions in them to find a significant difference between paired bins. I felt that this was a data collection problem, and not an inherent problem with the data itself. So, if a bin had only 15 transactions, I either doubled, tripled, or quadrupled the data points, as necessary, to increase the sample size. This left the median and the spread of the data the same—it just increased the sample size so that a difference could be detected with a still reasonably small sample, i.e., n <= 200.
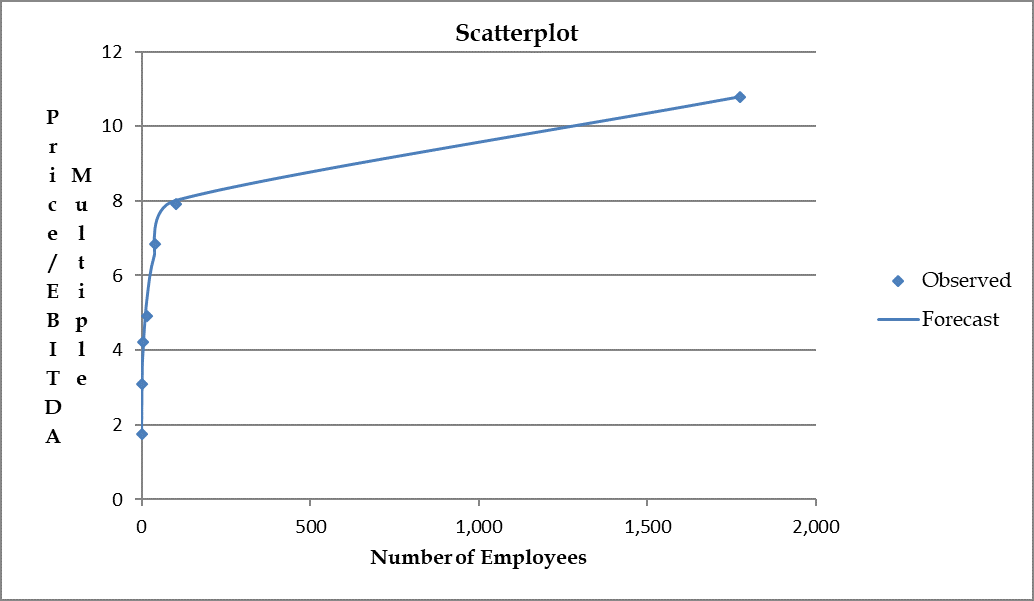
Of the six tests, one was significant at the 10% level, one at the 5% level, and four at the 2.5% level. I felt this result was good enough for business data, so I proceeded to the next step which was to match the median MVIC/EBITDA multiple for a particular bin with the median number of employees in that bin. When I plotted these seven matched variables, we saw an almost perfect logarithmic relationship. However, since there is no log for the number zero, I turned to the Weibull equation of a – be^{-cx^d}, to create a regression model that would fit the data well. The model’s four parameters are as follows: a = 10.937; b = 9.197; c = .146, and d = .446. All four coefficients are significant at the 5% level, the model’s r2 is .9937, and its coefficient of variation is just 6.15%.
The Weibull model allows us to forecast a subject company’s MVIC/EBITDA multiple based on the number of employees it has. However, I felt that while this feature was necessary to fine-tune a valuation result, I did not feel it sufficient enough on which to base a valuation conclusion. Therefore, I turned to another regression model to produce a preliminary valuation conclusion. I took the 599 transactions and ran a quadratic regression model, regressing MVIC against EBITDA and EBITDA2. I iteratively removed any transaction whose residual was more than 2.5 standard deviations from the trend line, and repeated this process until the model stabilized and there were no more outlier transactions. This resulted in keeping 433 transactions, a loss of 166 data points or 27.7% of the original 599. This model has the following coefficients: a = 39.764; b = 3.336 and c = .000606, with all coefficients significant at the 1% level. The r2 is .9989 and the coefficient of variation is 25.6%.
This regression model allows one to forecast an MVIC given a particular amount of EBITDA. Since most of the data points do not lie on the trend line, this raises the question of why an EBITDA of say, $70,000 might produce MVICs of between $85,000 and $590,000, or multiples between 1.2 and 8.2. Once more, as Steve Egna has pointed out, one possible reason is that buyers will pay more for a company that has institutionalized its profit-making capabilities by relying less on the owner and more on a greater number of employees. Put another way, the greater the amount of transferable personal goodwill the greater the value. And while more employees will result in a lower return on sales, it also requires a greater market share, or sales, to produce the same amount of EBITDA. This too would prove attractive to buyers, who would then have the opportunity to rationalize costs and expenses, and increase profits while holding sales constant.
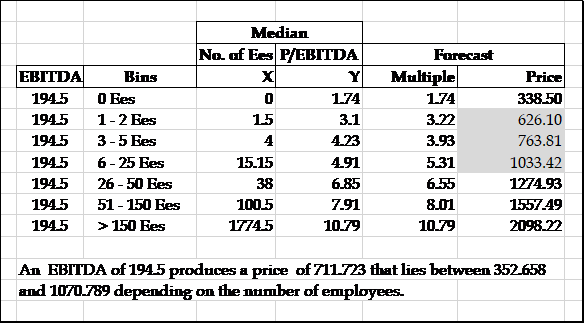
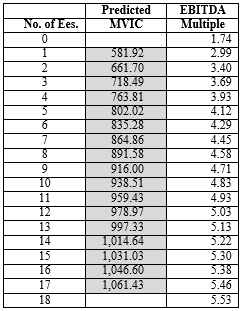
To account for the number of employees and to adjust the value accordingly, I created a prediction interval model that can accommodate any amount of forecasted value. For example, an EBITDA of $194,500 produces an MVIC of $711,723 which approximates the average MVIC of the 433 transactions. At a 95% confidence level, the prediction interval for this price ranges between $352,658 and $1,070,789. Therefore, any adjustment to the price based on the number of employees should fall into this range. Using the Weibull regression formula to forecast an MVIC/EBITDA multiple, I found that three employees will produce a value of $718,487, and that the employee numbers between one and 17 fall into the prediction interval previously described.

 The next step would be to apply the Weibull model to a value derived using a regression model from a specific subset of the NAICS three-digit 541 service industry code, i.e., to a specific service industry using the full six-digit industry code.
The remaining question is whether this protocol will work for manufacturers, wholesalers, and retailers.
Mark G. Filler, CPA, ABV, CVA, AM, CBA leads Filler & Associates’ Litigation and Claims Support practice in Portland, Maine. He has been in public accounting since February 1968. Mr. Filler has been a Certified Public Accountant since November 1972, a Certified Valuation Analyst since November 1994, a Certified Business Appraiser since May 1997, Accredited in Business Valuation since January 1999, and an Accredited Member since April 2004. His experience has been entirely with small firms, and his focus has been on helping small business entrepreneurs solve their tax and business problems. His services include: aid and advice around tax minimization, business planning and major business decisions, financing, determining management information needs, setting up cash management tools, instituting cost reduction and budgeting techniques, and the placement of bookkeepers and controllers.
Mr. Filler can be reached at (207) 591-6423 or by e-mail to mfiller@filler.com.


