
Best Practices for Estimating the Company-Specific Risk Premium
(Part III of IV)
This is the third of a four-part article that sets forth best practices for estimating the company-specific risk premium. This part of the discussion describes the various empirical data sources that analysts may consider as proxies—or benchmarks—or approximations—in developing the CSRP estimate.

[su_pullquote align=”right”]Resources:
Best Practices for Estimating the Company-Specific Risk Premium (Part I of IV)
Best Practices for Estimating the Company-Specific Risk Premium (Part II of IV)
[/su_pullquote]
Introduction
Estimating the cost of capital is one component of private company business valuation performed for financing, transaction, taxation, business planning, financial accounting, litigation, and other purposes. The cost of capital directly impacts every income approach business valuation analysis. The cost of capital indirectly impacts every market approach and asset-based approach business valuation analysis.
The first part of this discussion described the generally accepted cost of capital measurement models. That discussion focused on the company-specific risk premium (CSRP) component of the cost of capital. We summarized the reasons for including a CSRP in the cost of capital measurement used in a private company valuation and described the qualitative factors that analysts consider in developing the CSRP estimate.
The second part of this series described the concepts of systematic risk and unsystematic risk. That discussion summarized analyst best practices for (1) identifying and (2) documenting the components of unsystematic risk.
This part of the discussion describes the various empirical data sources that analysts may consider as proxies—or benchmarks—or approximations—in developing the CSRP estimate.
Proxies for the Company-Specific Risk Premium
The CSRP estimate is supported by the analyst’s professional judgment. Such professional judgment is based on consideration of (1) the qualitative factors that may affect the company-specific risk of the private company and (2) any market-derived empirical data that may provide a benchmark or approximation of the CSRP estimate.
There are various data sources that analysts may consider providing guidance as a proxy or benchmark in developing the CSRP estimate. Unlike the data sources that analysts may consider measuring the size-related risk premium (Sp) component of the cost of equity capital (Ke), these proxy data sources do not directly measure the CSRP.
Rather, these data sources may be considered by analysts to estimate the CSRP. These data sources represent proxies for—or substitutes for—the CSRP estimate. They are not databases or formulas that provide specific empirical evidence to directly measure the CSRP.
Ultimately, the CSRP estimate is supported by the analyst’s professional judgment and by the analyst’s functional analysis of the private company. The data sources described below provide an empirically based, quantitative test of the reasonableness of the analyst’s CSRP estimate.
The following discussion summarizes four empirically based, quantitative proxy data sources that analysts may consider as providing guidance in developing the CSRP estimate. These proxy data source analyses are as follows:
- Quantum of risk in the modified capital asset pricing model (MCAPM) and the build-up model (BUM)
- Quartile analysis of Duff & Phelps/Ibbotson 10th size decile
- Analysis of relative corporate bond ratings and yields
- Analysis of illiquidity studies (i.e., pre-initial public offering and restricted stock studies)
Quantum of Risk in the MCAPM
Analysts may consider the different levels (or components) of risk within a Ke measurement model such as the MCAPM or BUM to provide indications of the CSRP estimate. That is, each component of the MCAPM (i.e., risk-free rate of return [Rf], beta-adjusted equity risk premium [ERP], and Sp) represent a quantifiable level—or quantum—of risk applicable to the private company. These quantum of risk levels may be described as follows:
- The Rf is the rate of return that an investor would expect on an investment with no risk. Typically, the Rf sets the minimum rate of return that an investor will expect on any investment. The Rf measures the first quantum of risk in the Ke measurement model.
- The beta-adjusted ERP (in the MCAPM) or the combination of the ERP and the industry-related risk premium (IRP) (in the BUM) measure a second quantum of the expected rate of return on an investment in the business ownership interest. That is, typically this second risk level is the quantum of expected return that motivates investors to forego the riskless investment.
- The Sp is the expected rate of return that an investor expects for investing in small-capitalized companies. For many reasons (in addition to size), small-capitalized companies tend to be riskier investments than large-capitalized companies. The Sp provides the third quantum of the risk levels related to the private company.
The analyst now has to estimate the quantum for the fourth level of risk—the CSRP—associated with the private company investment. Analysts have empirically based, quantifiable evidence for the first three quanta of risk associated with an investment in the private company. Analysts can consider that empirically based, quantitative evidence in developing the CSRP estimate.
Presented in Table 1 is a hypothetical Ke measurement. This illustrative Ke measurement considers the first three empirically based measurable quanta of risk levels in the estimate of the fourth judgment-based quantum of risk level (i.e., the CSRP).
Table 1: Analyst’s Illustrative CSRP Estimate Based on a Proxy Risk Measurement for Analyst Guidance
The Quantum of Risk Measurement Procedure
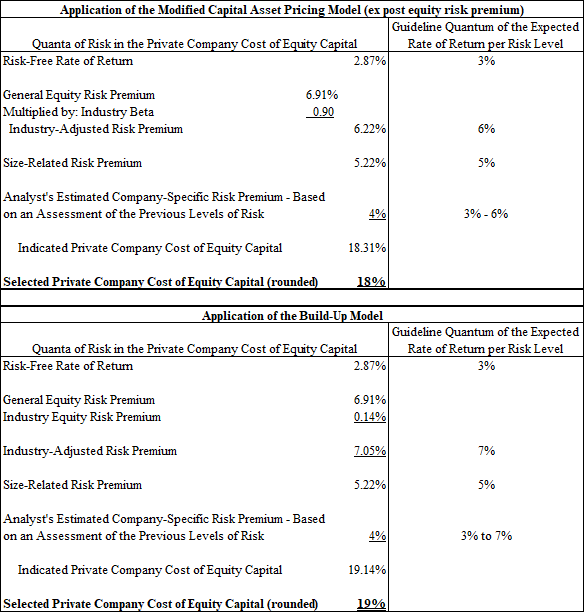
The guideline quanta of risk levels presented in Table 1 are based on illustrative data as of December 31, 2018. Specifically, (1) the Rf is based on the 20-year Treasury bond available as of December 31, 2018; (2) the ERP is the “ex post” ERP provided by the Duff & Phelps Cost of Capital Navigator; (3) the industry beta is based on hypothetical guideline publicly traded companies’ betas as reported by Bloomberg; (4) the IRP is provided by the Duff & Phelps Cost of Capital Navigator for general contractors—nonresidential buildings (presented solely as an illustrative industry group); and (5) the Sp is provided by the Duff & Phelps Cost of Capital Navigator for size decile 10.
Based on the empirically based quantum of risk data for each of the first three levels of investment risk included in Table 1, an analyst may conclude that 4 percent is a supportable CSRP estimate (i.e., the fourth quantum of risk of the Ke). That analyst conclusion is based on the consideration that the 4 percent CSRP estimate falls within the range of the other empirically based quantum of risk indications.
The average quantum of risk in the Table 1 MCAPM cost of capital analysis (before consideration of the CSRP quantum of risk) is 4.8 percent. And the average quantum of risk in the Table 1 BUM cost of capital analysis (before consideration of the CSRP quantum of risk) is 5.0 percent. An analyst may consider the average size of the quantum of risk measured in each of the first three Ke model components in order to develop a supportable quantum of the CSRP risk level.
The above CSRP quantum of risk level estimate may not be constant over time. Like all components of the Ke, the CSRP is subject to the prevailing economic conditions. Such prevailing economic conditions may upwardly or downwardly affect the various quanta of risk related to the various risk factors.
For example, if the Rf were to decrease from 2.9 percent in December 2018 to 1.9 percent in December 2019, it is likely that corresponding ERPs would decrease (all else being equal). If the expected return on a risk-free investment decreases, then the relative expected return needed to encourage an investor to forego the risk-free investment may also decrease.
The investor would not expect as much of a rate of return premium for investing in generally risky equity investments. This is because the alternative investment (i.e., a risk-free 20-year Treasury bond) now provides a lower rate of return. The quantum of a CSRP risk level indication based (at least in part) on the Rf and the general ERP components of the Ke may be correspondingly decreased.
Quartile Analysis of the CRSP Deciles Size Premia Studies 10th Decile
The analyst may consider the University of Chicago Center for Research in Security Prices (CRSP) Deciles Size Premia Studies 10th decile data (now presented in the Cost of Capital Navigator) to provide some empirical guidance to develop the CSRP estimate. While the CRSP Deciles Size Premia Studies data are typically relied on to quantify Sp, these data may also provide some guidance about developing the CSRP range.
The following discussion summarizes (1) the background on the CRSP Deciles Size Premia Studies data and (2) how the CRSP Deciles Size Premia Studies data may be considered to develop the CSRP estimate.
Background of the CRSP Deciles Size Premia Studies Data
The first comprehensive study of the size effect (i.e., the relationship of the size of a public company and the rate of return that investors expect on an investment in that company’s stock) was performed by Rolf Banz in 1981. Banz examined and compared the returns of small capitalized NYSE companies to the returns of large capitalized NYSE companies. The study was performed over the time horizon of 1926 to 1975.
In this study, Banz segmented all NYSE publicly traded companies into 10 deciles—the 1st decile being the largest capitalized public companies and the 10th decile being the smallest capitalized public companies.
Banz concluded that there was an observable negative relationship between (1) the size of a public company and (2) the historical equity investment returns.[1] That is, the Banz study concluded that as the public company size decreases, historical equity investment returns tend to increase—and vice versa. The so called “size effect,” however, was not linear. Rather, the “size effect” was most pronounced in the smallest capitalized public companies.
Furthermore, as the investment holding period increased, the small-capitalized public companies tended to outperform the large-capitalized public companies—in terms of providing a higher rate of return to their investors.
Many of the risk attributes that generally define small-capitalized public companies provide possible explanations for this empirically based relationship between (1) company size and (2) equity return on investment. In general, small-capitalized public company stocks are less liquid, harder to diversify, and tend to have less available investor information (due to limited security analyst coverage). Small-capitalized companies have fewer financial resources, operational resources, human resources, and strategic resources. These limited resources (compared to larger public companies) limit the smaller public company’s ability to prevent larger companies from entering its market and taking its market share.
Due to having better access to capital, large-capitalized public companies tend to have greater ability (1) to hire better quality employees, (2) to spend more on advertising and on research and development, and (3) to endure economic downturns. Additionally, when compared to small public companies, large public companies have a relatively high volume of customers, decreasing their reliance on a few key customers.
The functional and operational differences listed above (and this is not a comprehensive list) increase the risk associated with investing in a small public company compared with investing in a large company. Therefore, investors expect smaller public companies to provide a higher return on equity investment relative to larger public companies. This explanation is because investors expect to be compensated for assuming the greater level of investment risk in a smaller public company—compared to the level of investment risk in a larger public company.
The Sp quantifies the increased rate of return that investors expect in order to compensate them for assuming the risk associated with small company investments.
A significant relationship between size of a company and historical equity returns was observed in the Banz study. However, the study concluded that it is not clear whether the relationship is due to company size itself—or to other unknown variables correlated with company size.
That is, small company size may not cause risk—or cause the increased expected investment returns. Rather, the financial and operational disadvantages associated with small company size may be causing the risk—and causing investors to expect higher rates of return on their equity investment.
This Banz study conclusion is summarized in the following statement:
It is not known whether size [as measured by market capitalization] per se is responsible for the effect or whether size is just a proxy for one or more true unknown factors correlated with size.[2]
As a result of the Banz study, investment professionals began performing their own “size effect” studies. Applying the data reported by the CRSP, Roger Ibbotson and Rex Sinquefield performed a series of “size effect” studies that were published in the Morningstar/Ibbotson annual Stocks, Bonds, Bills, and Inflation (SBBI) Valuation Yearbook. Those studies were called the CRSP Deciles Size Premia Studies, and they were summarized annually in the SBBI Valuation Yearbook from 1999 to 2016.
In 2016, Morningstar announced it would no longer publish the CRSP Deciles Size Premia Study in the Ibbotson SBBI Valuation Yearbook. Starting with the 2016 edition, the annual study was prepared by Duff & Phelps, and it was published by John Wiley & Sons in the U.S. Guide to Cost of Capital Valuation Handbook.
The CRSP Deciles Size Premia Studies continue to segment the NYSE stock returns into deciles by size (as measured by the market capitalization of the publicly traded companies). Based on the NYSE decile breakpoints, the study now includes the entire universe of NYSE/NYSE MKT/Nasdaq-listed securities—rather than just the NYSE listed securities. And the CRSP deciles are now calculated from 1926 to the present year.
The CRSP deciles data include all publicly traded companies. That is, the CRSP Deciles Size Premia Studies data do not exclude financial services companies (companies in finance, insurance, or real estate) or high-financial-risk companies.
Duff & Phelps calculates the CRSP deciles size premiums as follows:
Size premia represent the difference between historical (observed) excess return and the excess return predicted by the capital asset pricing model (CAPM).
…
Excess returns are defined here as portfolio returns over and above the risk-free asset’s returns.[3]
In this study, the CAPM-predicted return is calculated as the product of (1) the beta (β) for the subject portfolio (i.e., the subject decile) of public stocks and (2) the expected return on the market portfolio of stocks in excess of the Rf times the ERP. The observed difference after the β adjustment demonstrates that the β of smaller companies does not fully explain the perceived risk associated with smaller companies. Therefore, the actual rate of equity return offered by smaller companies is not fully explained by the unadjusted CAPM alone. In other words, the β of small companies is underestimated. Accordingly, the unadjusted CAPM underestimates the Ke of smaller companies.
Empirical evidence indicates that the unadjusted CAPM as a measure for the expected returns for smaller companies is imperfect. As a result, it is a generally accepted procedure for analysts to consider a Sp in the Ke calculation. This Sp consideration is especially relevant for so-called “microcap” companies (i.e., the public companies with equity capitalization in the 9th and 10th deciles), where the Sp is more pronounced. The CRSP deciles size premium data can be used in the application of the MCAPM and of the BUM to estimate a Ke for a smaller size business ownership interest.
The CRSP Deciles Size Premia Study provides the size premiums data and other valuation data previously published in (1) the SBBI Valuation Yearbook and (2) the Duff & Phelps Valuation Handbook – U.S. Guide to Cost of Capital.
All size premiums provided by Duff & Phelps are “beta-adjusted.” This means that the size premiums are adjusted to remove the portion of the excess return (above the unadjusted CAPM estimate) that is attributable to beta alone. That is, the concluded size premium data by Duff & Phelps measure only the contribution of the size effect to the excess return (above the unadjusted CAPM estimate).
In the application of the MCAPM and the BUM, analysts often apply the CRSP data to estimate the specific Sp for a subject ownership interest. In developing the Sp, analysts may (1) first estimate the subject equity value by applying a market approach or an asset-based approach valuation method and (2) then select the applicable Duff & Phelps decile and Sp indication.
When applying the Sp and the IRP provided by Duff & Phelps, adding both an Sp and an IRP to the BUM analysis is not considered to be “double-counting” these risk premiums. This is because (1) the Sp is “beta-adjusted” and (2) the IRP is the measurement of the beta risk. In other words, these two different risk premiums were designed to account for two different types of risk.[4]
Considering the CRSP Deciles Size Premia Studies Data as a Proxy for CSRP
Analysts may consider an analysis of the CRSP Deciles Size Premia Study 10th decile as an empirically based proxy (or benchmark) in developing the CSRP estimate. The 10th decile is comprised of the smallest-capitalized public companies included in the CRSP Deciles Size Premia Study.
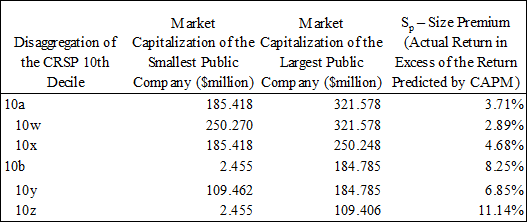
The public companies that comprise the 10th decile may be disaggregated into subcategories 10a and 10b, as presented below.
The public companies that comprise the 10a subdecile include companies with market capitalizations between $185.4 million and $321.6 million, and the reported size premium is 3.71 percent (as of December 31, 2018).
The public companies that comprise the 10b subdecile include companies with market capitalizations between $2.5 million and $184.8 million, and the reported size premium is 8.25 percent (as of December 31, 2018).
Within each of the 10a subdecile and 10b subdecile categories of the 10th decile, Duff & Phelps presents two additional subcategories. The 10a subdecile may be disaggregated into 10w and 10x subdeciles, while the subdecile 10b may be disaggregated into 10y and 10z subdeciles.
Companies that are classified in the 10th decile vary considerably in market capitalization and in the applicable Sp. The empirically derived Sp measurements range from 2.89 percent to 11.14 percent, a spread of 8.25 percent, or 825 basis points.
Table 2 presents an analysis of the CRSP Deciles Size Premia Study data for the 10th decile. The Table 2 empirical data were sourced from the Duff & Phelps Cost of Capital Navigator as of December 31, 2018. These empirical data present the disaggregation of the 10th decile, as of that date.
Table 2: CRSP Deciles Size Premia Studies Data Analysis of the 10th Decile as of December 31, 2018
The 10th decile disaggregation presented in Table 2 provides an indication that investment risk that may be related to more than just the Sp examined in the Duff & Phelps and Ibbotson data. For example, subdecile 10y and subdecile 10z are populated by many large (but highly leveraged) public companies with small equity capitalizations. Such large (in terms of revenue and/or assets) public companies with small equity capitalization probably do not match the characteristics of financially healthy but smaller public companies.
As presented in Table 2, as the size of public companies increases, the corresponding Sp decreases. That is why it is important for analysts to correctly interpret and apply the Sp expected return component of the MCAPM (and BUM) measurement of the Ke.
According to Duff & Phelps, “as of December 31, 2018, the reported size premium for the smallest 5 percent of companies by market capitalization as represented by CRSP subdecile 10b is 8.25 percent, and the size premium for the next smallest 5 percent of companies (as represented by CRSP subdecile 10a) is 3.71 percent, a difference of 4.54 percent.”[5]
Also, according to Duff & Phelps, “The CRSP Deciles Size Premia include all companies with no exclusion of speculative (e.g., start-up) or distressed companies whose market capitalization may be small because they are speculative or distressed.”[6]
The distressed company issue may be considered through an analysis of the 10th decile subcategories of 10y and 10z, as presented in Table 3 and Table 4.
Table 3: Analysis of the 10y Subdecile CRSP Deciles Size Premia Studies Data as of September 30, 2018

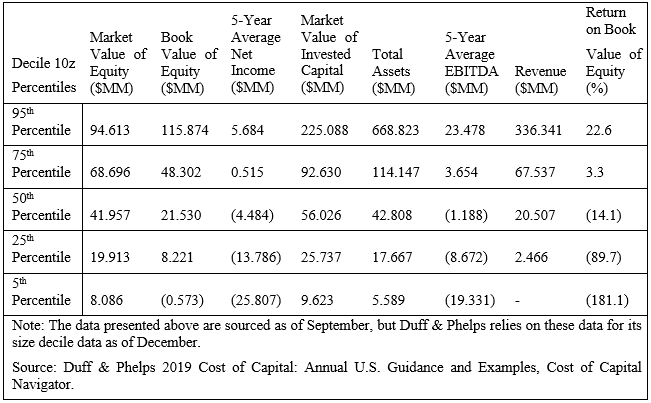
Table 4: Analysis of 10z Subdecile CRSP Deciles Size Premia Studies Data as of September 30, 2018
As presented in Table 3, the subdecile 10y public companies report five-year net income ranging from negative $44.5 million to a positive $14.7 million. The subdecile 10y public companies significantly smaller than other public companies in the CRSP Deciles Size Premia Study; in addition, more than half of these subdecile 10y companies are unprofitable.
As presented in Table 4, subdecile 10z includes public companies in the 5th percentile that report five-year average earnings before interest, taxes, depreciation, and amortization (EBITDA) of negative $19.3 million. The public companies classified in subdecile 10z at or below the 50th percentile (i.e., the lower quartile) reported negative EBITDA.
Collectively, the data in Tables 3 and 4 support the conclusion that the CRSP Deciles Size Premia Study 10th decile is comprised of financially troubled and financially distressed companies.
Moreover, Duff & Phelps presents the following conclusion about subdecile 10y and subdecile 10z:[7]
Subdecile 10y and subdecile 10z are populated by many large (but highly leveraged) companies with small market capitalizations that probably do not match the characteristics of financially healthy but small companies (see “Total Assets,” 95th percentile measures).
According to an article authored by James Hitchner in the journal Financial Valuation and Litigation Expert, “It’s important to note that 80 percent of the companies in decile category 10b are from 10z. As such, let us focus on 10z. At the 50th percentile of 10z the operating margin is -1.11 percent. Yes, on average, these companies are losing money. At the 25th percentile the operating margin is -21.27 percent. Furthermore, 62 percent of the companies in 10z are from only three industry sectors: financial services, technology, and healthcare.”[8]
Analysts may consider the Sp data associated with CRSP size categories 10w, 10x, 10y, and 10z to provide guidance for developing the private company CSRP estimate. These data are presented in the far-right column of Table 2 (as of December 31, 2018).
In particular, analysts may consider (1) the difference between the 10x and the 10w size premiums (e.g., 4.68 percent – 2.89 percent) and (2) the difference between the 10z and the 10y size premiums (e.g., 11.14 percent – 6.85 percent).
These size premiums differences (of approximately 2 percent to 4 percent) may provide an empirically based proxy or benchmark for the CSRP estimate.
Such consideration of the CRSP Deciles Size Premia Study 10th decile may provide a reasonableness test for the analyst’s judgment-based CSRP estimate with regard to the particular unsystematic risk profile of the private company.
As indicated by the Hitchner article, based on dated information that is still relevant, not only does the CRSP Deciles Size Premia Study 10th decile include financially troubled companies, it is also skewed by its industry concentration.
As presented above, the actual returns earned in excess of the returns predicted by the CAPM was 6.85 percent for subdecile 10y and 11.14 percent for subdecile 10z (or a difference of 429 basis points) as of December 31, 2018. This 4.29 percent return premium difference may (in part or in whole) be an indication of the quantum of return that is correlated with various types of financial and operational risk—and not just with the size of the private company. That is, the delta between (1) subdecile 10y and subdecile 10z or (2) subdecile 10a and subdecile 10b, may provide an indication for the investment return premiums related to the types of risks that are more often associated with the CSRP than with the Sp.
Analysis of Relative Bond Ratings and Bond Yields
The lack of diversification of the business operations of some private companies suggests that the relevant risk measure for investors may be “total risk.” Total risk includes unsystematic risk (i.e., the total risk associated with an investment in any ownership interest includes company-specific risk). That is, for an undiversified equity investment in a private company, some form of unsystematic risk likely exists—and should be considered when measuring the Ke.
However, quantifying the company-specific risk is a challenging process. In part, this is because most of the data typically considered to measure the Ke are based on public company information—and public companies tend to be well diversified. Such diversification tends to reduce or eliminate the company-specific risk component of the Ke.
Another procedure that analysts may consider as an empirically based proxy (or benchmark) to provide guidance in developing the CSRP estimate is an analysis of the high-yield bond spread. A high-yield bond is a bond with a credit rating below investment-grade corporate bonds.
High-yield bonds pay a higher yield than investment-grade bonds. This high yield is typically (1) because of some high-risk factors or (2) because the issuing debtor company is financially distressed.
The yield on a typical corporate bond is comprised of the following components:
- Real rate of return and a return premium for expected inflation. These two rates of return components are included in a government bond yield, also known as the risk-free rate—or the Rf.
- Default risk premium. The default risk premium is measured as the required rate of return in the market in order to compensate investors for the risk of default on a corporate bond. Typically, the default risk premium is measured as the spread between (1) the yields on risky corporate bonds and (2) the yield on a U.S. Treasury bond (the yield that is also known as the Rf).
The risk of default is one component of investment risk that is likely to be minimized (or diversified away) in a diversified portfolio of debt investments. For example, let’s assume an investor’s portfolio is made up of a well-diversified portfolio of, say, 100 different corporate bond holdings. The risk that a default of one—or a few—of those debt instrument investments having a significant negative impact on the investor’s portfolio return will be low.
The default risk premium in a high-yield bond is significantly higher than the default risk premium for an investment-grade bond. Such a default risk premium reflects the additional risk of a high-yield bond holder being unable to realize the expected cash flow from the issuing debtor company. In this way, the risk profile of the high-yield debt investor in a distressed debtor company is similar to the risk profile of an equity investor in a nondistressed company.
Because a high-yield bond is a bond with a credit rating below an investment-grade corporate bond, a high-yield bond typically pays a higher yield than an investment-grade bond. Of course, investors expect this higher yield because of the high-risk factors associated with the debtor company. The level of risk between the observed investment-grade corporate bonds and the high-yield “junk bonds” may provide a proxy to assist analysts in developing the CSRP estimate.
As presented in Table 5, the yields on various forms of bonds (and bond indices) vary based on the subject bond—or the subject bond index—risk profile.
Table 5: Bond Yields and Bond Index Yields as of December 31, 2018
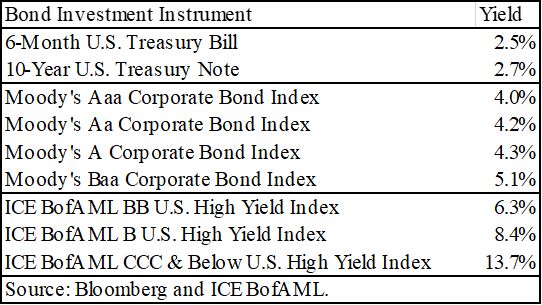
The first debt security presented in Table 5 is a six-month Treasury bill. Treasury bills (or T-bills) are sold with maturities ranging from a few days to 52 weeks. T-bills are typically sold at a price discount from the stated par amount (the par amount of a T-bill is also called the face value). Rarely, T-bills have sold at a price equal to the par amount. Such a sale effectively results in a 0 percent yield to the investor. When a T-bill matures, the security holder is paid the par amount. If the T-bill’s par amount is greater than the T-bill’s purchase price, then the difference is the interest (or the yield) earned by the investor.
The next debt security presented in Table 5 is a 10-year Treasury note. Treasury notes (or T-notes) earn a fixed rate of interest every six months until maturity. T-notes are issued with typical maturities of 2 years to 10 years.
In addition, the U.S. Department of Treasury also issues Treasury bonds. Treasury bonds (or T-bonds) pay a fixed rate of interest every six months until they mature. Treasury bonds are issued with typical maturities of 20 years or 30 years.
All T-bills, T-notes, and T-bonds are issued by the Treasury Department and are typically considered to be a risk-free security. As mentioned earlier, for technical data consistency purposes, the 20-year T-bond is typically used as the Rf when analysts measure the Ke.
The next tranche of debt securities presented in Table 5 is the long-term corporate bond indexes for Aaa, Aa, A, and Baa rated corporate bonds, as rated by Moody’s. Moody’s is an internationally recognized credit rating agency. These rating categories for corporate and institutional bonds (i.e., Aaa through Baa) are typically referred to as “investment grade.”
According to Moody’s, “long-term obligation ratings are opinions of the relative credit risk of fixed-income obligations with an original maturity of one year or more. They address the possibility that a financial obligation will not be honored as promised. Such ratings reflect both the likelihood of default and any financial loss suffered in the event of default.”[1]
Aaa-rated corporate debt obligations are considered to be of the highest quality with minimal risk. Aa-rated corporate debt obligations are considered to be of high quality and are subject to very low credit risk. A-rated corporate debt obligations are considered to be upper-medium-grade and are subject to low credit risk. Baa-rated corporate debt obligations are subject to moderate credit risk. Baa-rated corporate bonds are considered medium-grade and, as such, these bonds may possess speculative characteristics.
As presented in Table 5, the highest rated corporate bond index yield equals 4.0 percent, or 130 basis points above the 10-year T-note yield of 2.7 percent. That is, the incremental level of return required to attract a debt investor away from a risk-free investment to a risky (albeit low risk) investment is about 1.3 percent.
The third tranche of the debt securities presented in Table 5 is high-yield or “below investment grade.” Such debt instruments are market-capitalization-weighted indices of domestic corporate high-yield bonds. The indices track the performance of high-yield debt securities traded in the U.S. bond market.
The high yield debt securities are below investment-grade rating (based on an average rating of the Moody’s, S&P, and Fitch credit rating agencies). The debt securities included in these indices have at least 18 months to final maturity at the time of issuance, have at least a one-year remaining term to final maturity as of the rebalancing date, have a fixed coupon schedule, and have a minimum amount outstanding of $250 million.
As presented in Table 5, the lowest rated high-yield bond index yield as of the observation date equals 13.7 percent, which is (1) 530 basis points above the BB-rated index yield of 8.4 percent and (2) 860 basis points above the lowest investment-grade index yield of 5.1 percent.
The lowest rated bonds (i.e., CCC and below) are typically referred to as “junk” bonds. Junk bonds have a high risk of default. And, like the companies that comprise the Duff & Phelps subdecile 10y and subdecile 10z (discussed above), the debtor companies that issue such junk bonds are often financially distressed.
The difference in the level of return on junk bonds and on other “below-investment-grade” bonds may provide guidance to the analyst as a proxy or benchmark for developing the CSRP estimate.
That is, the incremental return between a junk bond index (13.7 percent from Table 5) and the BB-rated bond index (8.4 percent from Table 5) may provide an indication of the incremental return that debt investors expect as compensation for the factors that pertain to company-specific risk—such as financial distress, liquidity risk, and so forth.
In other words, the analyst may consider the yield differentials presented in Table 5 as one source of empirically based evidence to indicate a supportable CSRP estimate. In particular, the analyst may consider the difference between (1) the B-rated high yield investments (i.e., 8.4 percent on the observation date) and (2) the CCC and below-rated high-yield investments (i.e., 13.7 percent on the observation date). This differential in high-yield bond returns—of approximately 5 percent—may provide analysts with an empirically based reasonableness test for a judgment-based CSRP estimate.
While this analysis of high-yield debt instruments does not directly measure the CSRP, it may provide analysts with a proxy of empirically based data that provides guidance for developing the CSRP estimate.
Analysis of Illiquidity Studies (Pre-IPO and Restricted Stock Studies)
While typically used to estimate a supportable valuation discount for lack of marketability (DLOM), these studies may also provide a proxy—or benchmark—for a reasonableness test of the analyst’s judgment-based CSRP estimate. Relevant illiquidity studies that may provide an empirically based proxy for the analyst’s CSRP estimate include the following: (1) pre-initial public offering (IPO) studies such as the Emory Studies and the Valuation Advisor Studies, and (2) a variety of restricted stock studies.
The variety of so-called restricted stock studies all observe the market prices of public company restricted stock sales and include such actual transactional data dating back to the late 1960s. These restricted stock studies indicate an average price discount (compared to the trading price of the same public company stock without the trading restriction) for public company restricted stock of (1) approximately 35 percent for transactions occurring in the 1968 to 1988 period and (2) approximately 20 percent to 25 percent for transactions occurring after 1990. The decrease in the observed price discounts is typically explained by the more recent shortened investment holding period for restricted stocks under Securities and Exchange Commission Rule 144.
Analysts may consider the DLOM measurements indicated by the restricted stock studies as a proxy to assess the reasonableness of a judgment-based CSRP estimate. As a simplified illustrative example, let us assume that the analyst selects a 20 percent DLOM with regard to the private company valuation.
The analyst may test the reasonableness of the judgment-based CSRP estimate by reference to this DLOM proxy. Table 6 presents an illustrative example of such a CSRP estimate reasonableness test.
Table 6: Consideration of DLOM Empirical Data as a Proxy Data Source in the CSRP Estimate Reasonableness Test
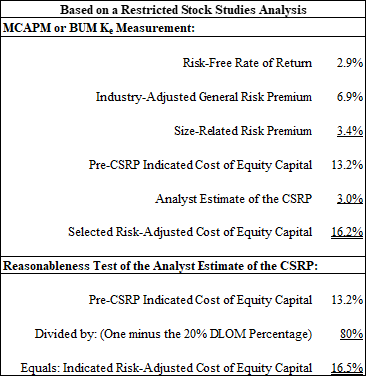
The pre-CSRP indicated Ke presented in Table 6 illustrates a hypothetical MCAPM or BUM measurement of the subject investment Ke—before consideration of the CSRP. The analyst considers the DLOM valuation adjustment to the pre-CSRP indicated Ke (that may be supportable for a public company). Adjusting the pre-CSRP indicated Ke by the selected DLOM results in a risk-adjusted Ke after consideration of the CSRP (that may be more supportable for a private company).
The 3.3 percent delta between the pre-CSRP indicated Ke (of 13.2 percent) and the risk-adjusted Ke (of 16.5 percent) provides an indication of the illiquidity component of the company-specific risk (expressed as a DLOM) in the Ke. That is, all else being equal, the difference between the public company Ke and the private company Ke (in this illustration, the 3.3 percent delta) may be explained as consideration of illiquidity issues that private companies experience (and that public companies do not experience).
This consideration of these illiquidity issues may not capture the total quantum of the CSRP for a private company. However, this consideration of the DLOM may provide the analyst with an empirically based proxy for the reasonableness test of a judgment-based CSRP estimate.
Summary
This third of a four-part discussion series summarized empirical data and quantitative analyses that analysts can consider as a benchmark—or proxy—in developing the CSRP estimate. At the very least, such empirical data sources may be used to assess the reasonableness of the analyst’s judgment-based CSRP estimate.
The fourth and final installment of this series will consider (1) a functional analysis of the private company, (2) an analysis of quantitative data related to a CSRP of a private company, and (3) the analyst’s estimate of the private company CSRP.
Robert Reilly, CPA, ASA, ABV, CVA, CFF, CMA, is Managing Director of Willamette Management Associate’ Chicago offices. His practice includes business valuation, forensic analysis, and financial opinion services.
Mr. Reilly has performed the following types of valuation and economic analyses: economic event analyses, merger and acquisition valuations, divestiture and spin-off valuations, solvency and insolvency analyses, fairness and adequacy opinions, reasonably equivalent value analyses, ESOP formation and adequate consideration analyses, private inurement/excess benefit/intermediate sanctions opinions, acquisition purchase accounting allocations, reasonableness of compensation analyses, restructuring and reorganization analyses, tangible property/intangible property intercompany transfer price analyses, and lost profits/reasonable royalty/cost to cure economic damages analyses.
He has prepared these valuation and economic analyses for the following purposes: transaction pricing and structuring (merger, acquisition, liquidation, and divestiture); taxation planning and compliance (federal income, gift, estate, and generation-skipping tax; state and local property tax; transfer tax); financing securitization and collateralization; employee corporate ownership (ESOP employer stock transaction and compliance valuations); forensic analysis and dispute resolution; strategic planning and management information; bankruptcy and reorganization (recapitalization, reorganization, restructuring); financial accounting and public reporting; and regulatory compliance and corporate governance.
Mr. Reilly can be contacted at (773) 399-4318 or by e-mail to rfreilly@willamette.com.
Connor Thurman is a senior associate with Willamette Management Associates. He performs the following types of valuation and economic analysis assignments: valuation of fractional ownership interests in businesses, forensic analysis, valuation of intangible assets and intellectual property, lost profits/economic damages analysis, and appraisal reviews.
Mr. Thurman prepares these valuation and forensic analyses for the following purposes: taxation planning and compliance (federal income, state and local property tax, transfer tax), forensic analysis and dispute resolution, marital dissolution, strategic information and corporate planning, ESOP transactions and financing, and ESOP-related litigation.
He performs these valuations for the following types of business entities and securities: closely held corporation business enterprises, closely held corporation noncontrolling ownership interests, various classes of common/preferred stock, general and limited partnership interests, professional service corporations, professional practices, and limited liability companies.
Mr. Thurman has performed these valuations for clients in the following industries: assisted living facilities, banking, coal power, electrical equipment manufacturers, electric utilities, food distribution, forestry products, grocery stores, logging, marijuana dispensaries, medical practices, natural gas distribution, natural gas power, natural gas transmission, oncology centers, railroads, real estate development, real estate holding, sawmills, telecommunications, transportation, travel agencies, and wineries.
Mr. Thurman can be contacted at (503) 243-7514 or by e-mail to cjthurman@willamette.com.
[1] Rolf W. Banz, “The Relationship between Return and Market Value of Common Stocks,” Journal of Financial Economics (March 1981).
[2] Roger J. Grabowski, “The Size Effect Continues to Be Relevant When Estimating the Cost of Capital,” Business Valuation Resources 37, no. 3 (Fall 2018): 94.
[3] Duff & Phelps 2017 Valuation Handbook – U.S. Guide to Cost of Capital, 8.
[4] Ibid., 8-1.
[5] Duff & Phelps 2019 Cost of Capital: Annual U.S. Guidance and Examples, Cost of Capital Navigator, 12.
[6] Ibid.
[7] Ibid., 15.
[8] Jim Hitchner, “How to ‘Rig’ a Valuation: The Discount Rate,” Financial Valuation and Litigation Expert (February/March 2013).
[9] Moody’s “Rating Scale and Definitions.”
Related posts
-

Legal Update: May 2025
-

Act Now Before It’s Too Late
-

Debating the Incremental DLOM
-

The Meritocracy of an Unregulated Market
-

Essential Guide to Gift Tax and Estate Planning
-

Understanding IPCPL Theory, Evidence, and Application
-

Company Specific Risk Premia
-

New Detailed Cost of Capital Case Study: Step-by-Step Comparison of the Kroll Cost of Capital Navigator, BVR Cost of Capital Pro, Damodaran Data, and Surveys
