Volatility and the DLOM
Working within the DLOM ambiguity
This review examines the impact of volatility as a risk factor in the discount for lack of marketability (DLOM) and answers questions regarding the flexibility of adjustment periods.

Volatility and the DLOM
In most calculations, finding an appropriate discount for lack of marketability (DLOM) for a minority interest, and measuring volatility is an issue. Frequently, appraisers value the interest at some date in the past. Thus, we are often using market data from on or before the valuation date, and looking at restricted stock transactions that require updating the economic conditions on the valuation date. Alternatively, a formula is used that requires an estimate of volatility.
The importance of volatility in a calculation of a DLOM raises several questions, such as how fast does volatility change? What is a reasonable volatility adjustment period to use? 30 days? Three months? Six months? Historical volatility or predictions of future volatility?
During the first nine months of 2012, we studied the values of 35 long-term equity anticipation securities (LEAPS) put options on stocks of publicly traded companies to gain some insight on these questions The use of LEAPS assumes two things: 1) that the discounts derived from them measure the holding period risks of the stocks of these 35 companies, and 2) more importantly, that the holding period risk is a major factor in the discount for lack of marketability. We believe these assumptions are valid, prima facie.
From a base group of 671 equity LEAPS in December 2011, we selected every 19th company alphabetically. The group of 35 companies is shown on Table A. In general, the group contained companies of all sizes; for example, from Hyperdynamics Corp. (HDY) to AT&T (T); all types, from Costco (COST) to Caterpillar (CAT); and all degrees of risk, from Bristol Myers Squbb (BMY) to Sirius XM Radio (SIRI) and Hecla Mining (HL).
On the first Wednesday of each month, December 2011 through September 2012, we calculated the percentage discount (the cost of price protection) as the cost of the put option divided by the price of the stock for both the 2013 and the 2014 put options (That is, put options whose expirations are in the third week of January in 2013 or 2014.). Thus, the holding period of the 2014 LEAPS in December 2011 was 25 ½ months, and it decreased to 16 ½ months in September 2012. The holding period of the 2013 LEAPS was 12 months shorter in each case.
We related monthly changes in each company’s discounts to themselves, to discounts of the other companies, and to VIX, “a constant, 30-day measure of the expected volatility of the S&P 500 Index.” i
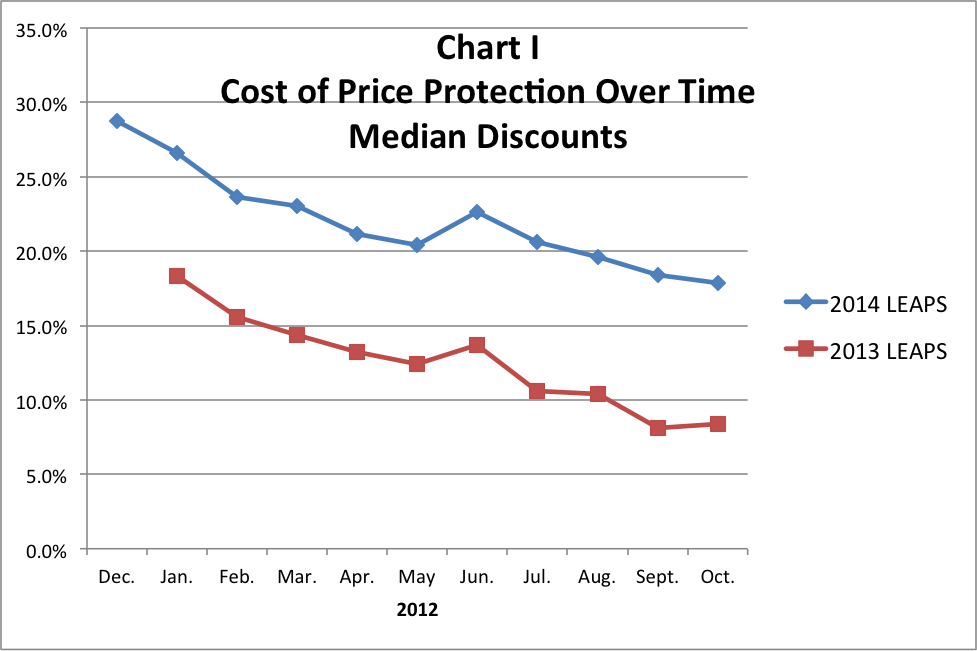
One conclusion is that, in general, the longer the holding period, the greater is the risk and the greater the cost of price protection. As Chart I shows, in December 2011, 25 ½ months before expiration, the median discount of the 2014 LEAPS was 28.7 percent. By October 2012, the 2014 LEAPS median had declined to 17.9 percent. In October 2012, the 2013 LEAPS expired in 3 ½ months and the median discount was 8.4 percent .
Someone may note that, on average, discounts decline about one percent per month or slightly less. Applying that fact to discounts in general would be a gross error Studies show that option costs decline at a faster rate as expiration dates get closer. Moreover, using such an average ignores specific company risks, which can and do differ greatly.

A corollary observation from these facts is that, if an appraiser is using restricted stock study comparables to establish a DLOM, the lengths of the expected holding periods for the stocks chosen must be reasonably comparable to the subject, because shorter holding periods will produce lower discounts.
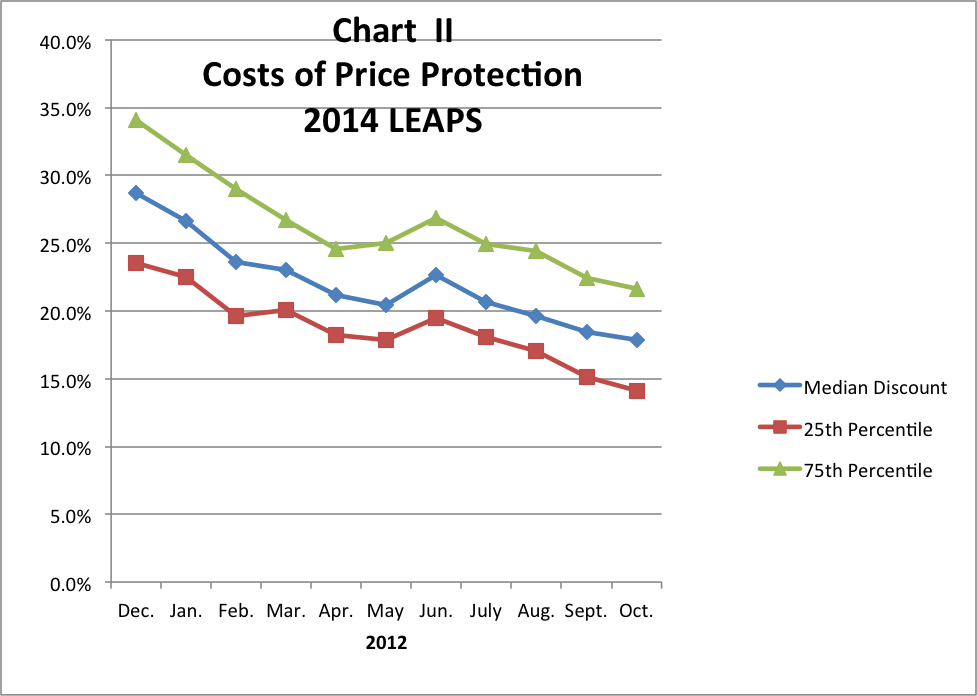
Chart II shows the range of the middle 50 percent of discounts for LEAPS that expire in 2014. It is interesting that the 75th percentile line is uniformly higher above the median than the 25th percentile is below the median. In every month studied, the 75th percentile was four percent to five percent greater (in absolute numbers) than the median and the 25th percentile was three percent to four percent lower than the median. That fact suggests that market makers more frequently set option prices on the side of higher (larger) discounts (reflecting greater risk) than on the side of smaller discounts and lesser risk. Appraisers determining DLOMs are well advised to do the same thing.

In Charts I and II, the abrupt upward change in discounts in June illustrates the degree of volatility that can occur in a relatively benign economic period (relative to the 2008–2009 period). Discounts change fast.Â
Chart III (below) shows how much the absolute discounts of each of the 35 companies changed in each month.1 Note the degree of change: “Discounts Increased”; “Discounts Down–0.1 to 5.0 percent”; Discounts Down–5.1 to 10.0 percent”; and “Discounts Down– 0.1 percent or more.” In May 2012, 25 of 35 discounts decreased up to five percent. The following month, June 2012, 32 of 35 discounts increased. In the next month, July 2012, 27 of 35 companies had discounts decrease by more than five percent. Percentage-wise, VIX –the CBOE’s Volatility Index–changed more than the 2014 LEAPS discounts, probably because the length of the risk period was shorter in the VIX. But, it is obvious that that VIX is not a very good measure for short term holding periods let alone longer terms.
| Chart III | |||||||||||
| 2014 LEAPS | |||||||||||
| Individual Company Movements (# of Co.’s) | |||||||||||
| Change from prior month to current month | |||||||||||
| Â | Â | Â | Â | Â | Â | Â | Â | Â | Â | Â | Â |
| Â | Â | Â | 2/1/12 | 3/7/12 | 4/4/12 | 5/2/12 | 6/6/12 | 7/5/12 | 8/1/12 | 9/7/12 | 10/3/12 |
| Discounts Increased | Â | 5 | 6 | 2 | 9 | 32 | 3 | 10 | 3 | 5 | |
| No Change | Â | Â | 0 | 0 | 0 | 0 | 0 | 0 | 1 | 0 | 0 |
| Discts. Down – 0.1% to 5.0% | 25 | 26 | 30 | 25 | 0 | 5 | 13 | 11 | 10 | ||
| Discts. Down – 5.1% to 10.0% | 3 | 3 | 2 | 1 | 0 | 14 | 9 | 17 | 16 | ||
| Discts. Down – 10.1% or more | 2 | 0 | 1 | 0 | 3 | 13 | 2 | 4 | 4 | ||
| Â | Â | Â | Â | Â | Â | Â | Â | Â | Â | Â | Â |
| Â | Â | Â | Â | Â | Â | Â | Â | Â | Â | Â | Â |
| VIX value | Â | Â | $18.55 | $19.07 | $16.42 | $16.88 | $22.16 | $17.57 | $18.96 | $14.38 | $15.43 |
| Change VIX from prior month | -16.5% | 2.8% | -13.9% | 2.8% | 31.3% | -20.7% | 7.9% | -24.2% | 7.3% | ||
| Â | Â | Â | Â | Â | Â | Â | Â | Â | Â | Â | Â |
Some appraisers will argue that +/- five percent for a DLOM is the most accurate result one can expect, so the use of a longer term volatility estimate is an adequate solution. As Chart III demonstrates, discounts from 2014 LEAPS did not change as quickly nor as much as the 30-day VIX. A longer term VIX (say 60 days or 90 days) would not have captured the impacts on discounts in May, June, and July.
So what is one to do? I propose that the use of LEAPS to determine a minimum DLOM is required. By definition, LEAPS contain a volatility estimate and are the market’s judgment of risk and volatility on a specific date.
This article first appeared in the 2QTR 2013 Business Appraisal Practice. Some appraisers will argue that +/- five percent for a DLOM is the most accurate result one can expect, so the use of a longer term volatility estimate is an adequate solution. As Chart III demonstrates, discounts from 2014 LEAPS did not change as quickly nor as much as the 30-day VIX. A longer term VIX (say 60 days or 90 days) would not have captured the impacts on discounts in May, June, and July.
So what is one to do? I propose that the use of LEAPS to determine a minimum DLOM is required. By definition, LEAPS contain a volatility estimate and are the market’s judgment of risk and volatility on a specific date.
TABLE A
| Â | Stock |
| Company Name | Symbol |
| Â | Â |
| ACME PACKETÂ INC. | APKT |
| AMERICA MOVILÂ S.A.B. DE C.V. ADS R | AMX |
| AMERICAN CAPITAL AGENCY CORP. | AGNC |
| ARCELOR MITTAL NY REGISTRY SHS CL-A | MT |
| AT&T INC. COM | T |
| ATLAS ENERGYÂ L.P. | ATLS |
| BAKER HUGHES INC | BHI |
| BANK OF AMERICA CORP | BAC |
| BED BATH & BEYOND INC | BBBY |
| BRISTOL MYERS SQUIBB COMPANY | BMY |
| CATERPILLAR INC | CAT |
| CME GROUPÂ INC. | CME |
| COLGATE-PALMOLIVE CO | CL |
| COSTCO WHOLESALE CORP-NEW | COST |
| EATON CORP | ETN |
| ELDORADO GOLD CORP (NEW) | EGO |
| ESTEE LAUDER CO”S INC CL-A | EL |
| FOSTER WHEELER AG | FWLT |
| GOLDMAN SACHS GROUP INC | GS |
| HALLIBURTON CO (HOLDING CO) | HAL |
| HARMONY GOLD MNG SP ADR-NEW | HMY |
| HECLA MINING CO | HL |
| HYPERDYNAMICS CORP | HDY |
| KEYCORP (NEW) | KEY |
| LENNAR CORP CL A COMMON | LEN |
| MACY”S INC. | M |
| NYSE EURONEXT | NYX |
| OCZ TECHNOLOGY GROUP INC | OCZ |
| OVERSEAS SHIPHOLDING GROUP | OSG |
| PIONEER NAT RES CO | PXD |
| RACKSPACE HOSTINGÂ INC. COM | RAX |
| SAKS INCORPORATED | SKS |
| SIRIUS XM RADIO INC. | SIRI |
| THE BANK OF NEW YORK MELLON CORP. | BK |
| UNITED TECHNOLOGIES CORP | UTX |
1  Chart III shows the absolute change in the discount from the prior month to the current month. For example, the discount was 15.7 percent last month and is 14.6 percent this month. The change is -1.1 percent (15.7- 14.6 percent).
i Chicago Board of Exchange at http://www.cboe.com/products/indexopts/vixoptions_spec.aspx
This article first appeared in the 2QTR 2013 Business Appraisal Practice.
[author] [author_image timthumb=’on’]http://www.sbgbusinessvaluation.com/RSeamanSBG-069.jpg[/author_image] [author_info]Ronald M. Seaman, FASA, is the founder and president of Southland Business Group, Inc. and DLOM, Inc. in Tampa, FL. He is the author of Leaps and the DLOM, now available at www.dlom-info.com. He is the past international president of the American Society of Appraisers.[/author_info] [/author]


