Probability Based Estimation and the DLOM Calculation
Refining and Selecting the Appropriate DLOM
The discount for lack of marketability (DLOM) is the result of illiquidity. It represents the inability to sell quickly when an investor decides to sell an asset. It is the economic cost of failing to realize gains or to avoid losses during the time period that the investor or closely held business owner is trying to sell the asset or securities. In this article, Marc Vianello describes an approach he describes as more “refined” than other methods for estimating DLOM.
 Discount for lack of marketability (DLOM) is the result of illiquidity. It represents the inability to sell quickly when an investor decides to sell an asset. It is the economic cost of failing to realize gains or to avoid losses during the time period that the investor or closely held business owner is trying to sell the asset or securities.
DLOMs Specific to the Valuation Subject
In this article, I describe how my approach provides business valuation practitioners a method to calculate the DLOM that is more refined. I have developed the VFC DLOM Calculator™ for readers and practitioners interested in adopting or evaluating this approach. How does my approach differ from other DLOM approaches used in the industry?
The VFC DLOM Calculator uses the Longstaff look back option formula and predicted marketing period and price volatility probabilities to deliver DLOMs that reflect the full range of likely outcomes—giving objective weight to each likely time and price occurrence. In a manner that cannot be done with restricted stock and pre-IPO studies, the VFC DLOM Calculator enables practitioners to craft DLOM conclusions that are specific to a valuation subject and a valuation date by drawing data from all of the thousands of stocks and millions of transactions that occur in the stock markets. Although the precise specifications applicable to a particular valuation engagement require the judgment of a highly skilled professional, the VFC DLOM Calculator aids the practitioner by: (a) quickly and accurately making all of the necessary calculations, and (b) providing robust diagnostics to enhance analysis and communication to others.
Probability Estimates
The two variables that are required by the Longstaff formula are marketing period and price volatility. The marketing period is the predicted time period to sell an asset. Price volatility is the price risk associated with the asset.
Analysis of transaction data from the BIZCOMPS® and Pratt’s Stats® databases shows that the marketing periods of privately-held businesses are influenced by its industry, geography, year, month, and size. These factors result in log-normal distributions of time periods. The VFC DLOM Calculator provides easy-to-use drop down lists to tailor a marketing period specific to the valuation subject based on relevant factors calculated from BIZCOMPS data. The practitioner can alternatively enter his or her own marketing period metrics. Once the marketing period inputs are provided, the VFC DLOM Calculator will calculate the marketing period probability distribution on a log-normal basis.
Analysis of price volatility data shows that it distributes on a log-normal basis when determined in absolute terms (i.e., all changes stated as positive numbers). The VFC DLOM Calculator aids practitioners by automatically calculating price volatility means and standard deviations using publicly-traded guideline companies and/or indices selected by the practitioner. What would a practitioner need to do? The practitioner would just enter the ticker symbols of the guidelines. Alternatively, the practitioner can enter his or her own price volatility metrics. Once the price volatility inputs are provided, the VFC DLOM Calculator calculates the price volatility probability distribution on a log-normal basis.
Calculating DLOM
The VFC DLOM Calculator provides users with the flexibility to select the methodology that works best for their engagement. Users may choose among: (a) a single probability DLOM [either marketing period or price volatility probability], or (b) a double probability DLOM [both marketing period and price volatility probabilities]. The probability distributions are divided into segments for which a DLOM is calculated. It is possible that the more extreme marketing period and price volatility segments will yield “raw” DLOMs greater than 100%. The VFC DLOM Calculator limits these occurrences to 100%. Then each as-limited DLOM is weighted for the relative probability of its segment. The sum of the weighted DLOMs is a probability-adjusted DLOM.
Diagnostic Tools
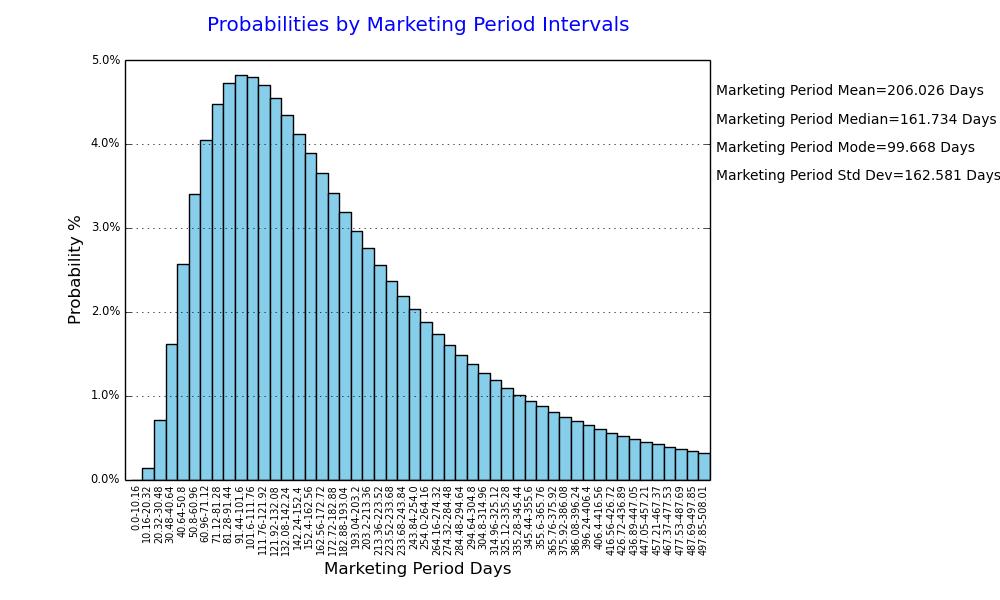
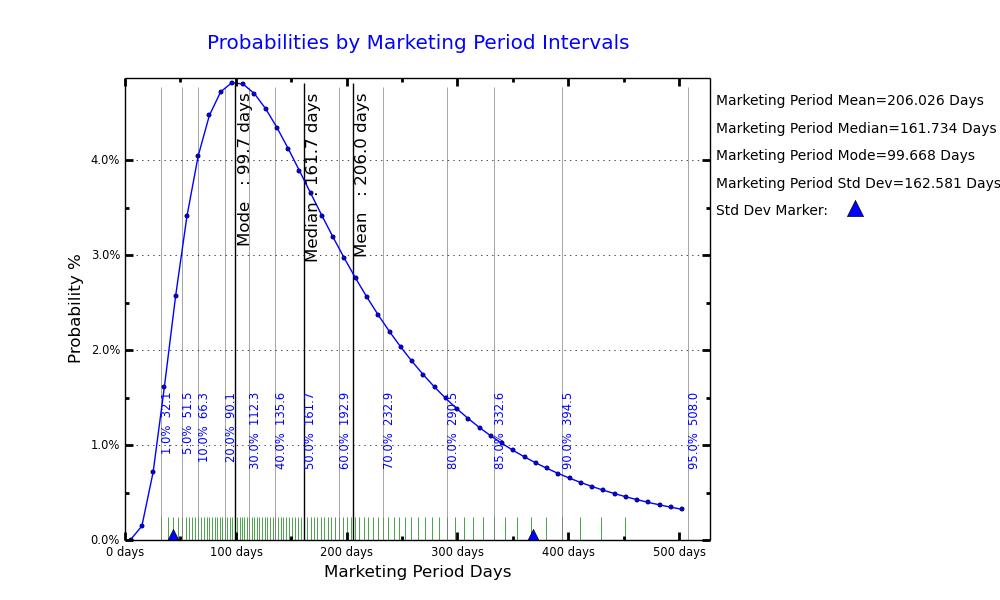
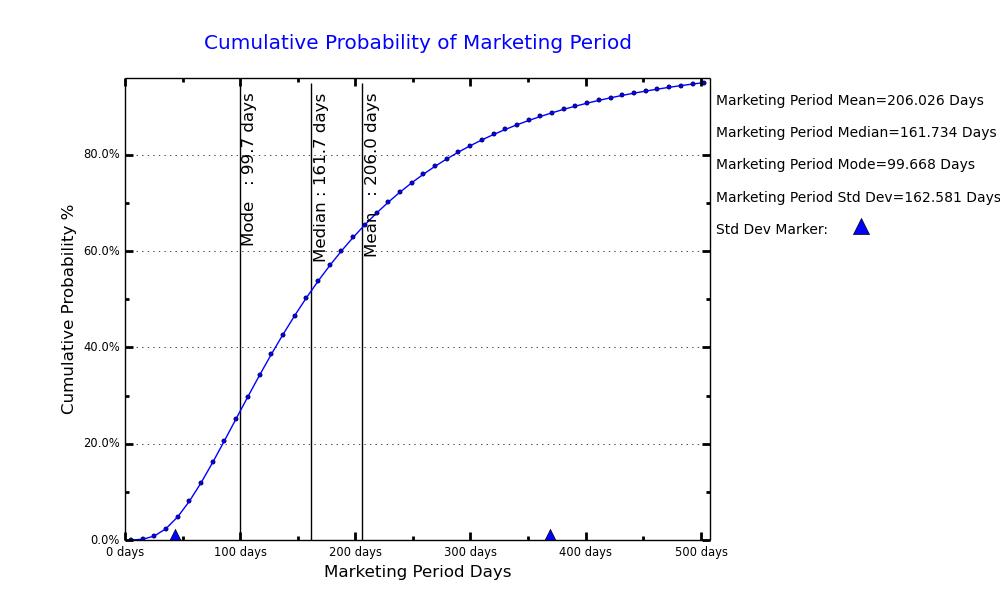
Practitioners can use the diagnostic tools of the VFC Marketing Period Estimator to challenge, refine, and support a variety of conclusions. The following graphs illustrate the approach:
- The column version of the graph, “Probabilities by Marketing Period Intervals” allows the user to consider the relative probability of a sale occurring in a particular time period.
- The line version of the graph, “Probabilities by Marketing Period Intervals” presents the mean, median, and mode of the range of marketing period probabilities, provides an indication of the relative concentration of anticipated sale events, and provides a means of estimating the percentage of sales events predicted to have occurred after a particular number of marketing days have elapsed.
- A graph of the increase in the cumulative probability of the marketing period as time passes. This graph also presents the mean, median, and mode of the range of marketing period probabilities.
Price Volatility Estimation
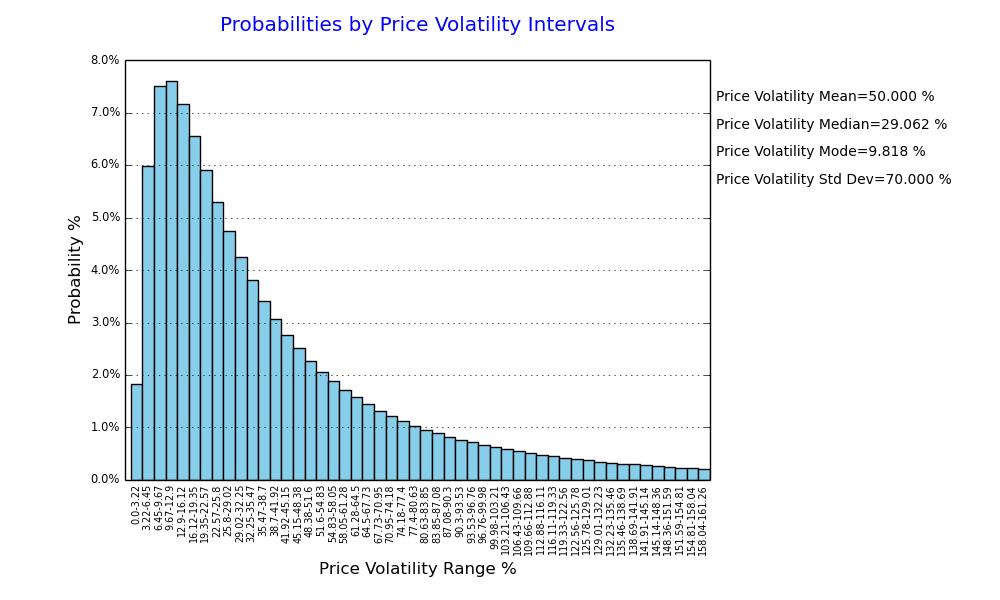
Practitioners can use the diagnostic tools of the VFC Price Volatility Estimator to reach conclusions regarding the price risk associated with holding a particular asset. The Price Volatility Estimator provides diagnostic tools similar to those of the Marketing Period Estimator:
- A graph of the probability distribution of price volatility. This graph allows the user to estimate the probability of a particular change in price occurring.
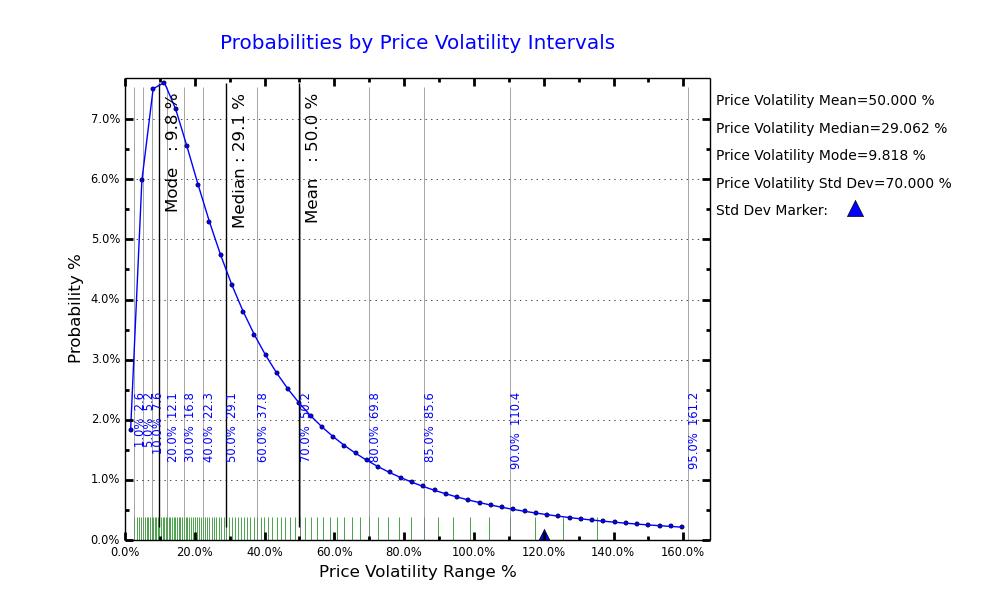
- A probability density graph. This graph presents the mean, median, and mode of the range of price volatility probabilities, provides an indication of the relative concentration of price volatility events, and provides a means of estimating the likelihood of particular price volatility events occurring.
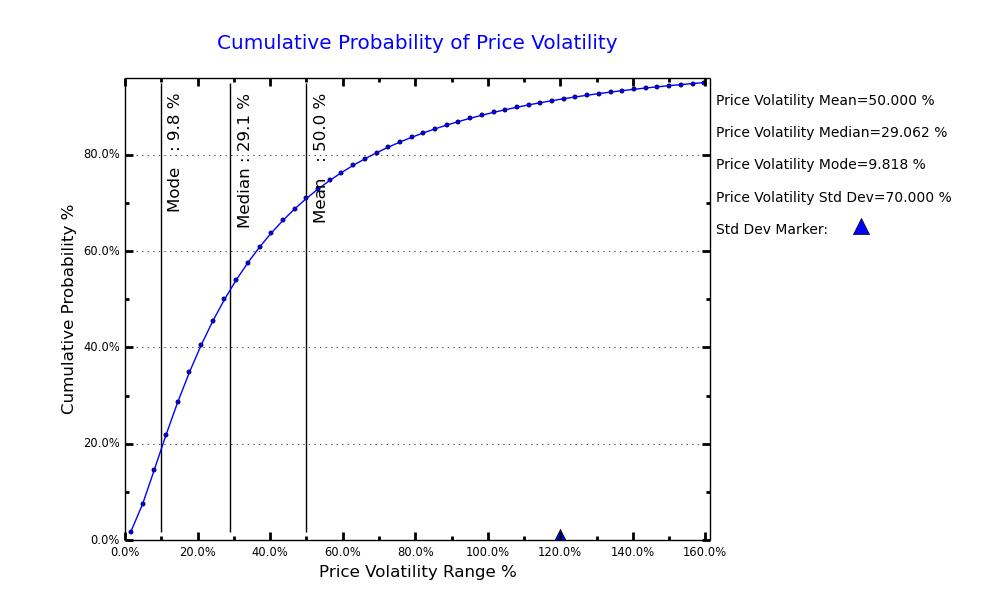
- A graph of the increase in the cumulative probability of price volatility as the range of volatility increases. This graph also presents the mean, median, and mode of the range of price volatility probabilities.
DLOM Based on Marketing Period Probability
The VFC Single Probability DLOM Calculator allows the user to provide a fixed price volatility assumption while using marketing period probability to calculate a probability-adjusted DLOM. In this application, the user receives diagnostic tools in addition to those described for the Marketing Period Estimator:
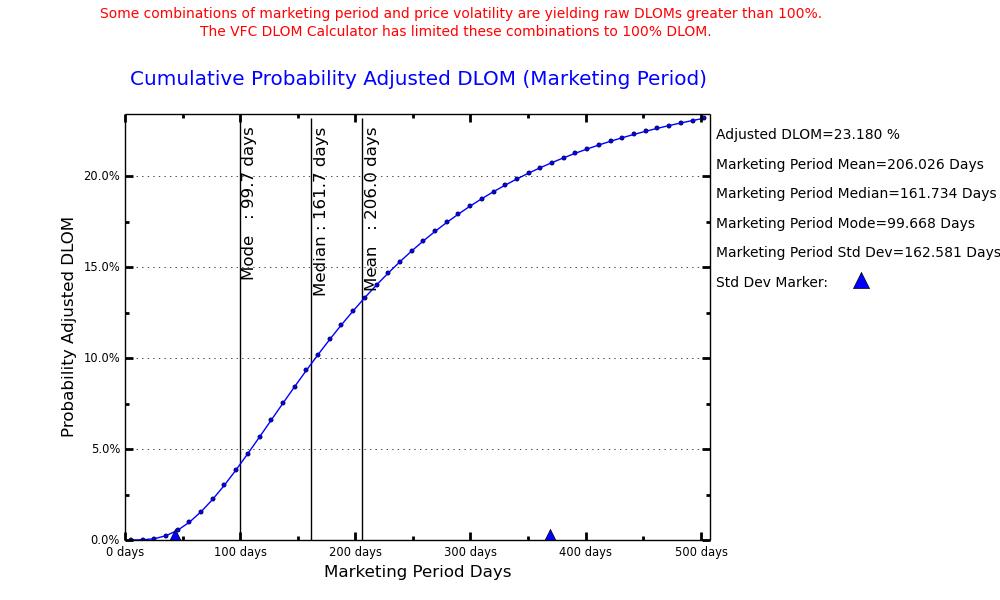
- A graph showing the cumulative probability-adjusted of DLOM as the marketing period increases. This graph also presents the mean, median, and mode of estimated DLOM over the range of marketing period probabilities, and allows practitioners to consider and communicate the sensitivity of DLOM calculations to changes in marketing period assumptions.
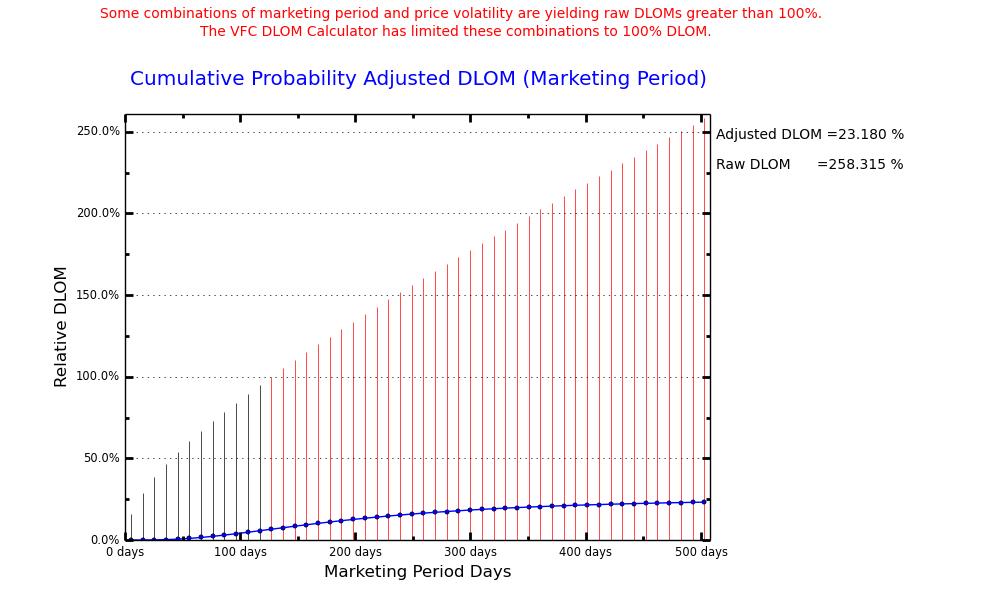
- A graph that compares: (a) the cumulative growth of the Probability-Adjusted DLOM, and (b) the “raw” Longstaff DLOM value that would result from applying the Longstaff formula to a particular marketing period without limiting the calculated DLOM to 100% or adjusting for the probability of occurrence. Marketing periods resulting in “raw” DLOMs greater than 100% are shown in red. This graph allows practitioners to consider and communicate the effects of 100% limitation and probability on calculated DLOMs.
DLOM Based on Price Volatility Probability
The VFC Single Probability DLOM Calculator alternatively allows the user the option of fixing the marketing period assumption while using price volatility probability. In this application, the user receives diagnostic tools similar to those described for DLOM based on Marketing Period Probability in addition to the tools described for the Price Volatility Estimator:
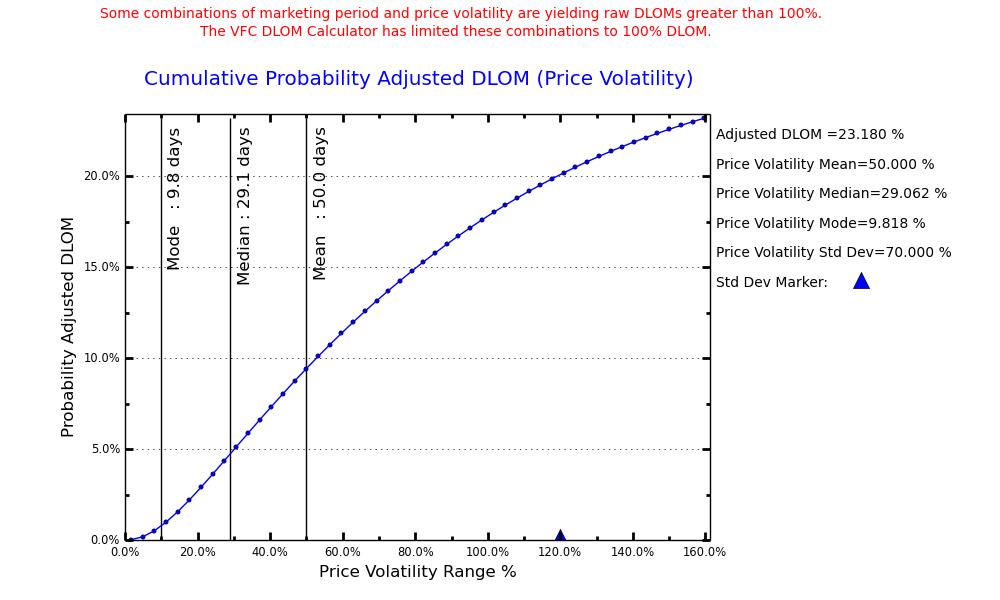
- A graph showing cumulative probability-adjusted DLOM as the price volatility increases. This graph also presents the mean, median, and mode of estimated DLOM over the range of price volatility probabilities, and allows practitioners to consider and communicate the sensitivity of DLOM calculations to changes in price volatility assumptions.
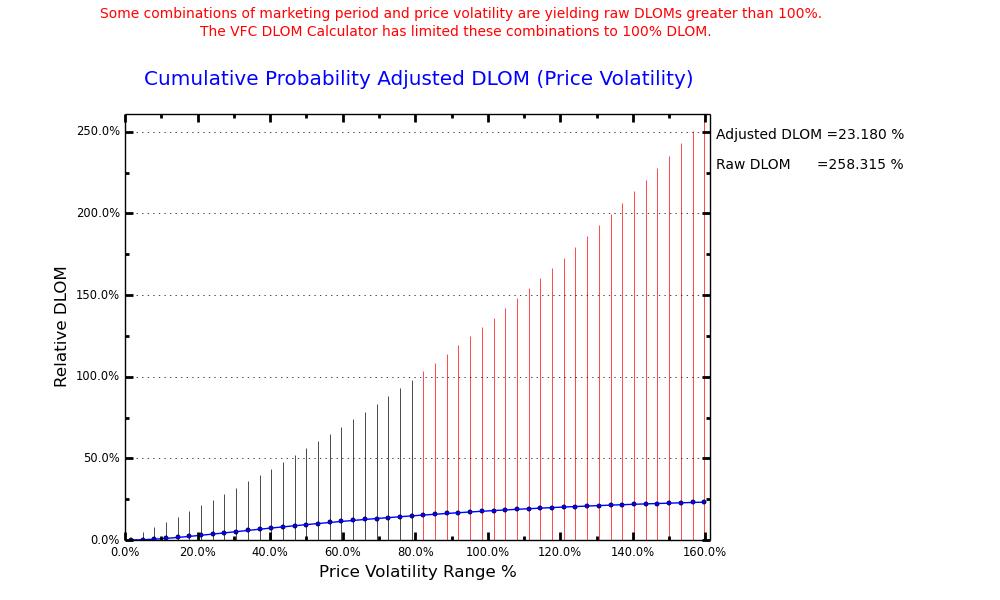
- A graph that compares: (a) the cumulative growth of the Probability-Adjusted DLOM, and (b) the “raw” Longstaff DLOM value that would result from applying the Longstaff formula to a particular price volatility without limiting the calculated DLOM to 100% or adjusting for the probability of occurrence. Price volatilities resulting in “raw” DLOMs greater than 100% are shown in red. This graph allows practitioners to consider and communicate the effects of 100% limitation and probability on calculated DLOMs.
DLOM Based on Both Marketing Period and Price Volatility Probability
The VFC Double Probability DLOM Calculator allows the user the option of basing DLOM on the combined effects of marketing period and price volatility probabilities. In this application, the user receives diagnostic tools in addition to those described for the Single Probability DLOM Estimators and Calculators:
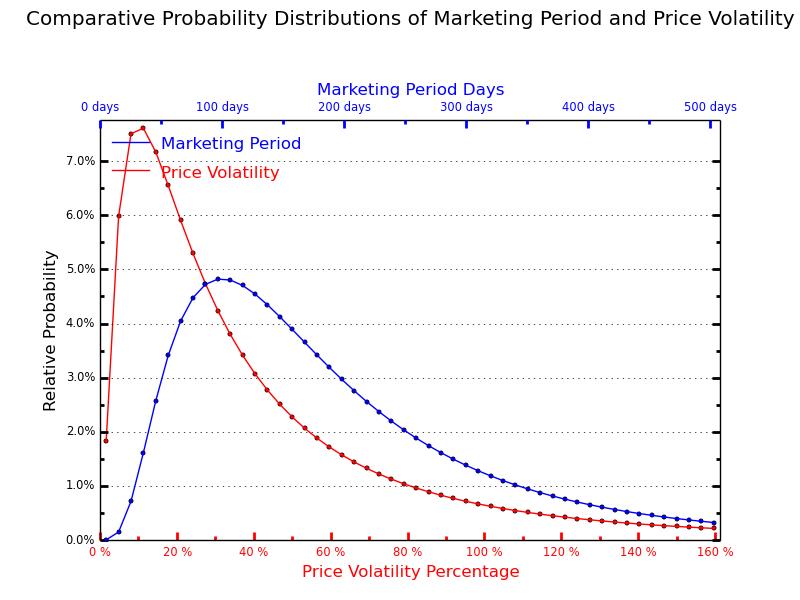
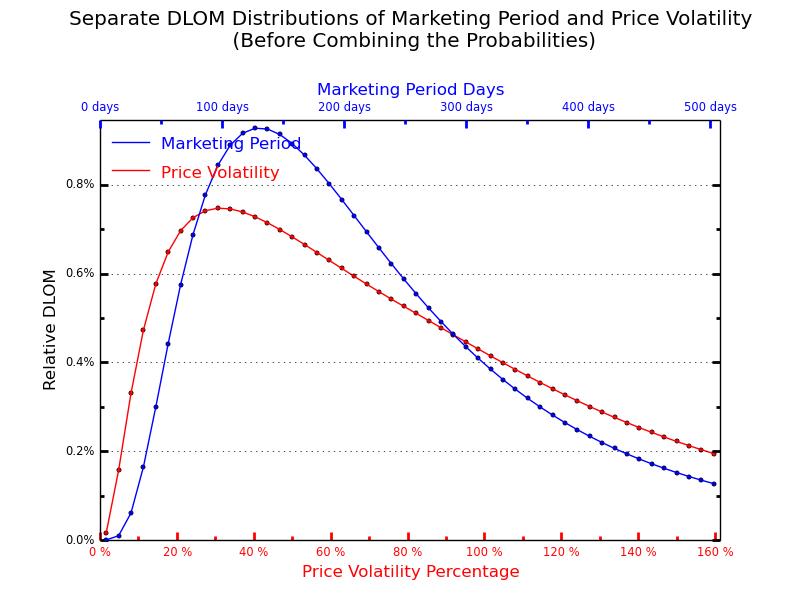
- A graph comparing the probability distributions of the predicted marketing periods and price volatilities. This graph allows the user to visualize and communicate the distribution of marketing period and price volatility probabilities.
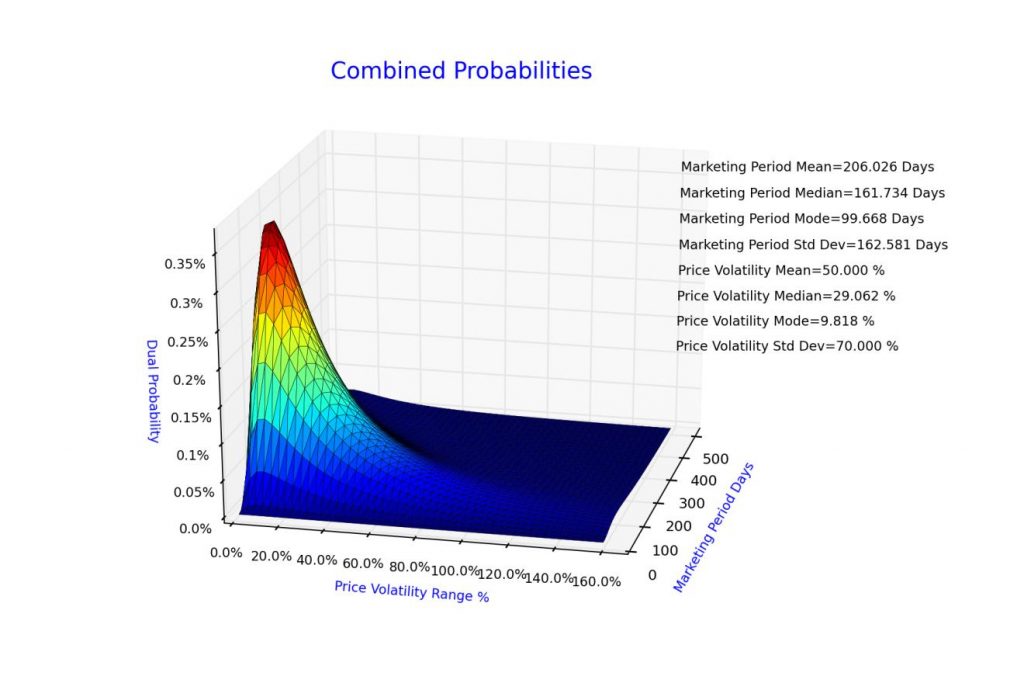
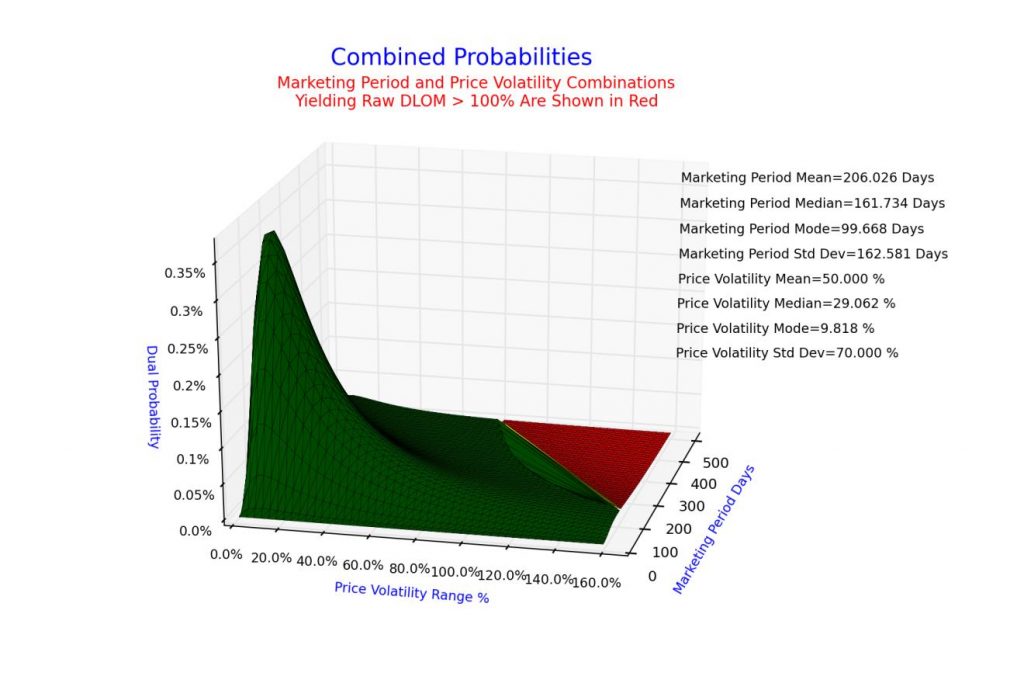
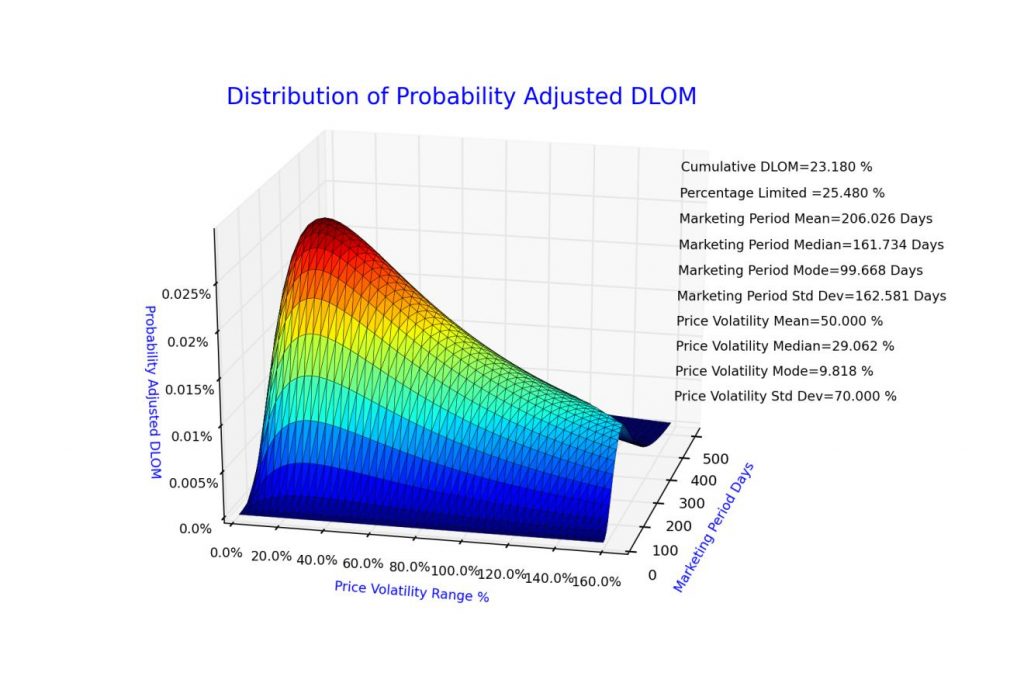
- A three-dimensional graph showing the distribution of the combinations of price volatilities and marketing periods. This graph allows the user to visualize and communicate the relative likelihood of a particular combination of marketing period and price volatility occurring.
- A two-dimensional matrix graph of the probability events color coded in red to show events for which the raw Longstaff DLOM value exceeds 100%. This graph displays the marketing period and price volatility combinations that the Double Probability DLOM Calculator has limited to 100% DLOM.
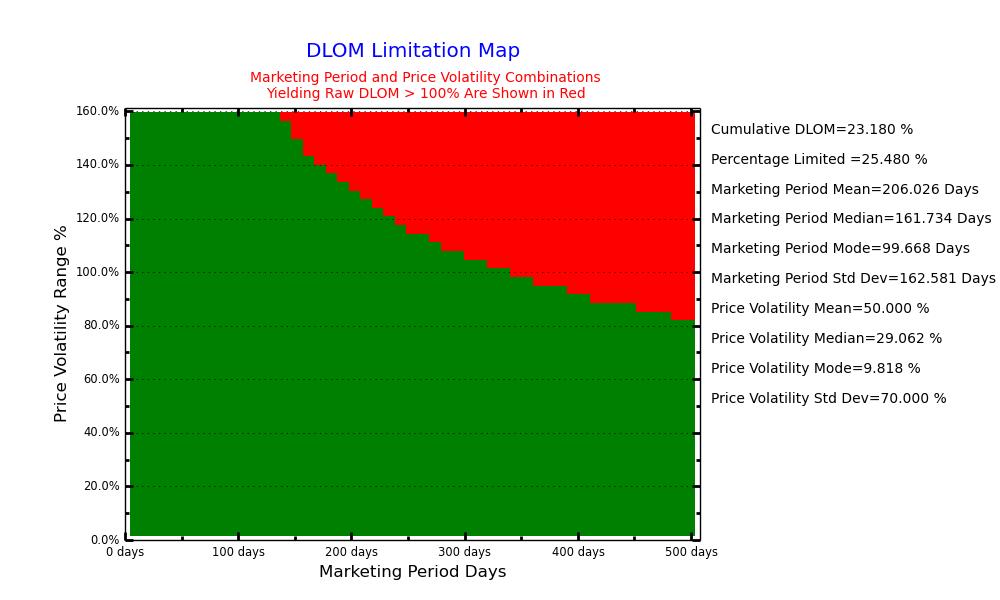
- A three-dimensional graph of the probability events color coded in red to show events for which the raw Longstaff DLOM values exceed 100%. This graph allows the user to visualize and communicate the overall influence of marketing period and price volatility combinations that have been limited by the VFC DLOM Calculator to 100% DLOM.
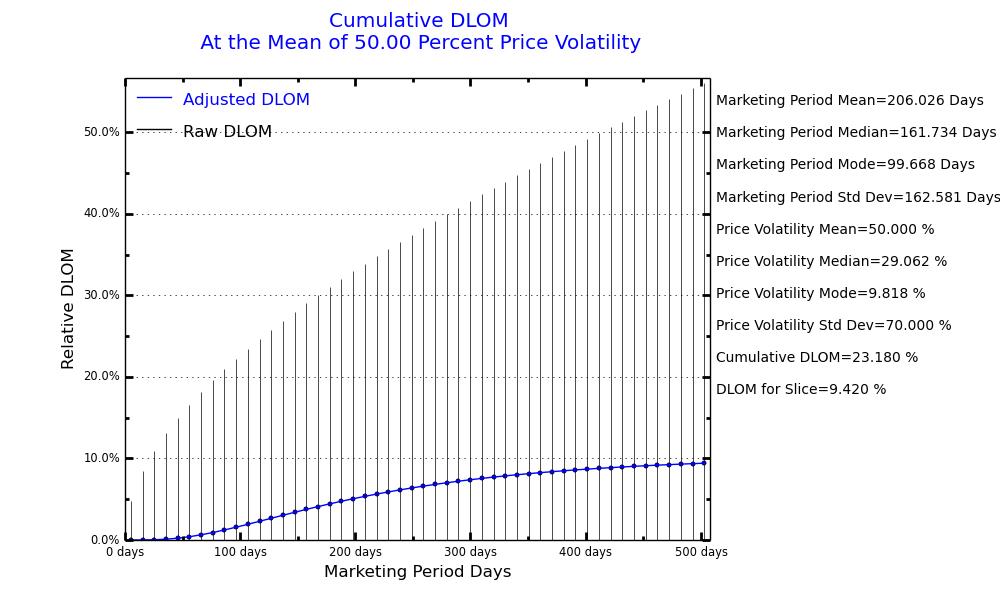
- A series of graphs that compare: (a) the cumulative growth of probability-adjusted DLOM over time measured at the mean, median, and mode of price volatility, and (b) the raw Longstaff DLOM value that would result from applying the Longstaff formula for the particular marketing period without adjusting for the probability of occurrence or limiting the calculated DLOM to 100%. Marketing periods resulting in greater than 100% DLOM for a fixed volatility are shown in red if they occur.
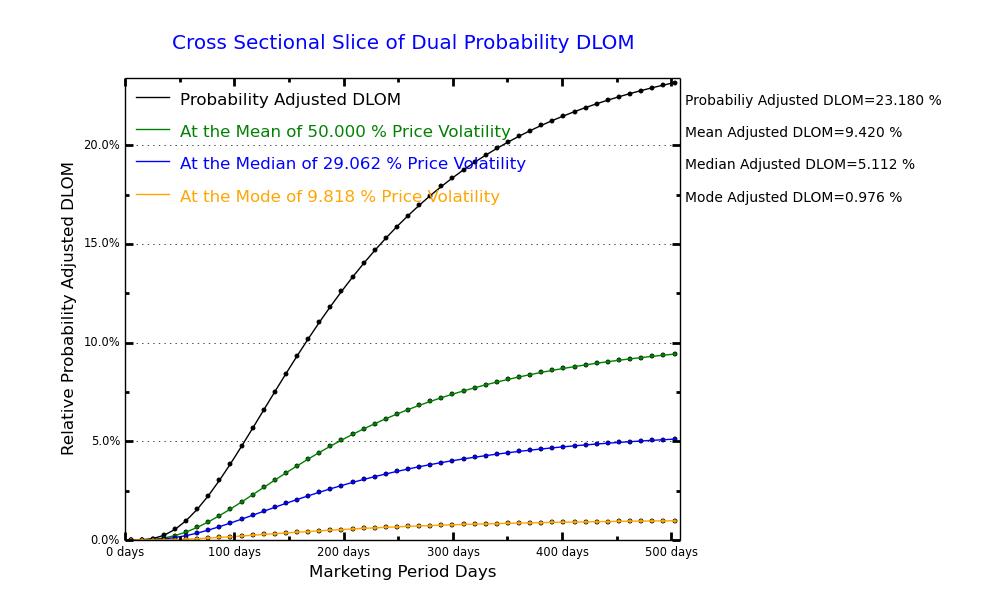
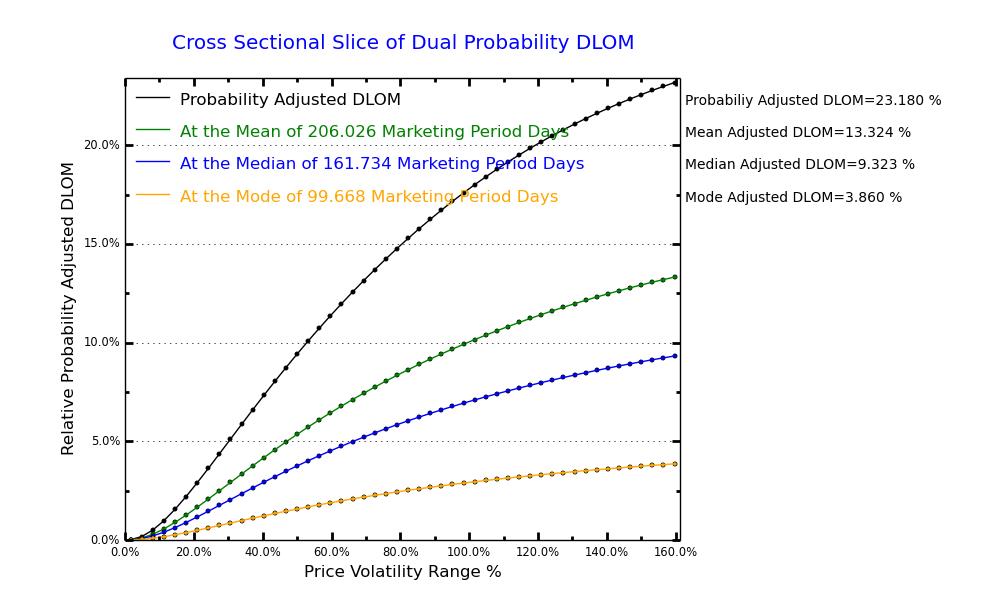
- A graph that compares the cumulative growth of DLOM measured at the mean, median, and mode of price volatility, and the cumulative growth of the Probability-Based DLOM.
- A series of graphs that compare: (a) the cumulative growth of probability adjusted and value limited DLOM over the predicted range of price volatility measured at the mean, median, and mode of marketing period probabilities, and (b) the raw Longstaff DLOM value that would result from applying the Longstaff formula for the particular price volatility without adjusting for the probability of occurrence or limiting the calculated DLOM to 100%. Price volatilities resulting in greater than 100% DLOM for a fixed marketing period are shown in red if they occur.
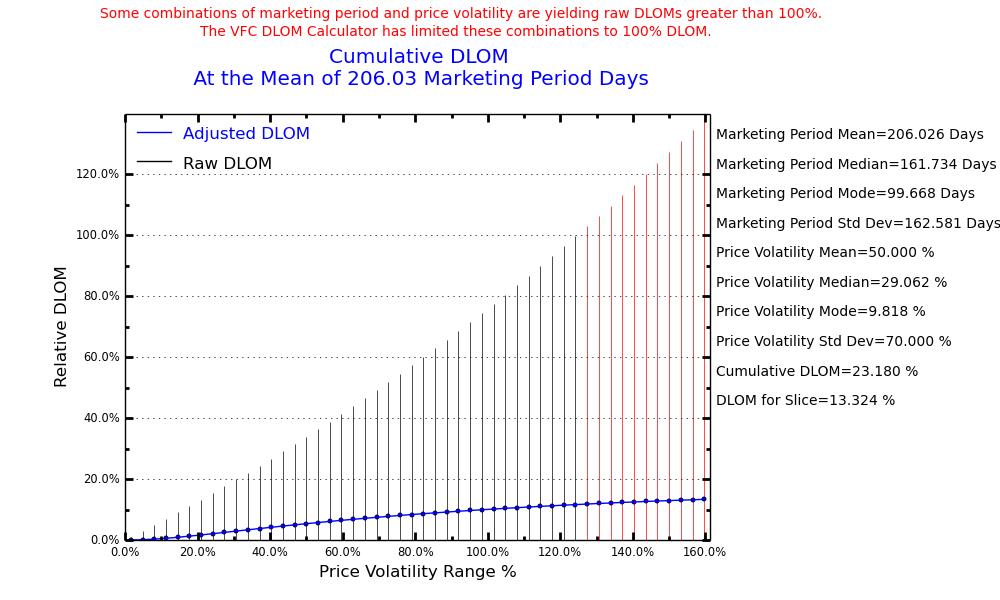
- A graph that compares the cumulative growth of the raw Longstaff DLOM measured at the mean, median, and mode of marketing period probabilities, and the cumulative growth of the Probability-Based DLOM.
- A graph comparing the distributions of DLOM based on the predicted marketing period and price volatility trends. This graph allows the user to visualize the different influences of marketing period and price volatility on the Probability-Based DLOM.
- A three-dimensional graph showing the distribution of the Probability-Based DLOM. This graph allows the user to visualize how DLOM is influenced by the combination of the range of marketing period and price volatility probabilities.
Downloadable Data
All VFC Estimators and DLOM Calculators provide users with downloadable tables of the values supporting the graphs, and a summary of the estimation factors and results:
- Mean and standard deviation of the marketing period parameters selected by the user.
- Mean and standard deviation of the marketing period parameters optionally provided by the user.
- Adjusted mean marketing period and adjusted standard deviation used by the Marketing Period Estimator, and the resulting median and mode marketing periods.
- Publicly traded companies that the user optionally selected as guidelines for price volatility estimation.
- Mean and standard deviation of the price volatility of each guideline company for 50-day, 100-day, 250-day, and 500-day price look back periods, and for a time period that the user may have optionally specified.
- Average mean and average standard deviation of the price volatility of the guideline company group for 50-day, 100-day, 250-day, and 500-day price look back periods, and for a time period that the user may have optionally specified.
- Mean, median, mode, and standard deviation of the price volatility probabilities for 50-day, 100-day, 250-day, and 500-day price look back periods, and for a time period that the user may have optionally specified.
- Time period that the user may have optionally specified for price volatility determination and the resulting mean, median, mode, and standard deviation.
- Average mean and average standard deviation used by the Price Volatility Estimator and the resulting price volatility median and mode.
- Probability-weighted DLOM.
- Mean, median, and mode of the probability-weighted DLOM.
- Adjusted and raw Longstaff DLOM values measured at the points of the mean, median, and mode of the marketing period and price volatility probabilities.
- Probability of each combination of marketing period and price volatility.
- Calculated DLOM for each combination of marketing period and price volatility probability.
I propose that the approach presented here enables practitioners to present a more defensible and refined DLOM calculation vis-à-vis may of those currently used by valuation professionals. It allows practitioners to use their professional judgment to identify appropriate measures of the risks associated with marketing illiquid assets; to assist in testing the sensitivity of the variables that affect those risks; and to be able to explain why they concluded that the estimated DLOM is the best quantification of the risks of illiquidity.
Copyright © 2014 Vianello Forensic Consulting, LLC
Marc Vianello, CPA, ABV, CFF is Managing Member of Vianello Forensic Consulting, LLC, an Overland Park, Kansas expert witness and business valuation consulting and advisory services firm. Mr. Vianello is also the creator of the VFC DLOM Calculator described in this article. Mr. Vianello can be reached at (913) 432-1331 or by e-mail at Vianello@vianello.biz.


