A White Paper Detailing Use of the Pluris Database to Develop a DLOM (Part III of III)
The Pluris DLOM methodology involves calculating two values: Restricted Stock Equivalent Discount (RSED) and Private Equity Discount Increment (PEDI). Does RSED represent an illiquid position that does not directly relate to the lack of marketability of a private held business? How reliable is the RSED DLOM? As for PEDI, how reliable is the methodology? In this article, Marc Vianello answers these questions and provides more insight on the methodology employed. Read Part I here. Read Part II here.
 In this final part, Marc Vianello shares his views on the uses of the Pluris® DLOM methodology and database for purposes of developing a discount for lack of marketability.
[su_pullquote align=”right”]Resources:
Pluris DLOM Valuation Advisors
20 Valuation Databases & Resources in 60 Minutes (Fasten Your Seatbelts!)
[/su_pullquote]
Section VII
Using the Pluris Methodology for Calculating DLOM
The Pluris DLOM methodology involves calculating two values: Restricted Stock Equivalent Discount (RSED) and Private Equity Discount Increment (PEDI). According to Pluris, the RSED represents an illiquid position that does not directly relate to the lack of marketability of a privately held business. We agree that restricted stock discounts represent illiquid positions, but we do not agree that they necessarily represent DLOM. The RSED calculated by Pluris may overstate DLOM by including non-DLOM compensation to the investor, or may understate DLOM as shown by the Pluris database transactions with negative discounts. Regardless, the restricted stocks comprising the Pluris DLOM Database™ represent shares in companies with publicly traded classes of stock. That is not the situation with the stock of a privately held business, which should be more illiquid and require a greater discount than the pure DLOM associated with the restricted stock of a publicly traded company. Pluris developed its PEDI concept to account for this difference in circumstances.[1] It is our view that the addition of a PEDI to a DLOM based on a publicly traded benchmark is a reasonable thing to do. See subsection 2.B. for discussion of the justification of a PEDI.
2.A. How Pluris Calculates its Restricted Stock Equivalent Discount (RSED)
Pluris calculates the RSED component of a DLOM using two methods. Method 1 is called, “Analysis of Data Download.” Method 2 is called, “Analysis of Entire Database.”
For Method 1—Analysis of Data Download, the user searches and sorts the transactions in the Pluris DLOM Database to identify transactions considered comparable to the valuation subject. Transactions may be filtered by SIC code, industry sector, price volatility, market capitalization, revenue, assets, block size, or many other criteria. The calculation of RSED is then based on the filtered transactions.[2] As discussed in Section VI, finding reasonably comparable transactions within the database is highly unlikely.
For Method 2—Analysis of Entire Database, it is generally the case that all of the restricted stock transactions are included in the calculation of RSED. The exceptions are: 1) if the time between the issue date and first announcement date exceeds ninety days; 2) if the daily stock trading volume of the publicly traded issuer is less than $5,000; 3) if the publicly traded stock of the issuer is a penny stock (i.e., ten-day volume-weighted average price prior to issue date less than one dollar); 4) if the publicly traded stock of the issuer trades on the pink sheet market.[3]
Once the transaction pool is established, Methods 1 and 2 calculate RSED the same way. The Pluris DLOM Database uses eight specified valuation parameters to calculate RSED: total assets, total revenues, EBITDA, net income, net profit margin (calculated automatically when the user enters amounts for net income and total revenue), equity (book value), enterprise value, and the ratio of market value-to-book value.[4] For each parameter, the calculator then divides the Method 1 or Method 2 transactions into quartiles. For each quartile, the median common stock discount is identified. Accordingly, each quartile of each parameter ultimately represents a single data point for which fifty percent of all transactions in the quartile have larger values, while fifty percent of all transactions in the quartile have smaller values.
The user enters the valuation parameters for the subject company into the RSED calculation spreadsheet, which returns the median restricted stock discount for the quartile in which the subject company input falls. Calculated RSED percentages are, therefore, based generally on just eight median data points—one for each of the specified parameters—extracted from either: (a) the specifically selected at least one transaction for Method 1; or (b) the 3,632 (before limitation) restricted stock transactions comprising the transaction database for Method 2. The Pluris calculator then averages the median values for each parameter that the user put into the calculator to arrive at the RSED percentage.
Additional problems with the Pluris DLOM methodology will be discussed later, but one evident at this stage is that 87.5% of all transaction values are greater than the first quartile medians and 87.5% of all transaction values are less than the forth quartile medians of each of the calculation parameters. Relative to the second quartile medians, 62.5% of all transactions have greater values, and relative to the third quartile medians, 62.5% of all transactions have smaller values for each of the calculation parameters. These facts leave a great many values omitted from resulting DLOMs, even if one is only concerned with the eight parameters specifically comprising the calculator. Importantly, a Pluris RSED can never be less than the median value of the lowest quartile nor more than the median value of the highest quartile. This artificial bracketing magnifies the unreliability of the low correlation of the financial parameters and observed discounts from which RSED values are calculated. It seems a problematic methodology that generally relies on just eight median data points out of the more than 220,000 pieces of data available for the 3,632 transactions in the database. For the eight specific parameters of the calculator, there are 29,048 available pieces of data that are essentially ignored.[5]
2.B. How Pluris Calculates its Private Equity Discount Increment (PEDI)
Pluris calculates PEDI by comparing the discounts associated with the largest block transactions (presumed to be the least liquid) to the average and median discount indications of all the transactions in the database.[6] Pluris says, “Underlying this methodology is the notion that transactions in the largest blocks serve as the best proxy for the lack of marketability of small blocks of stock in privately held companies,” and, therefore, a PEDI should be added to the RSED when the subject company is not a public company issuing restricted stock. But, the largest blocks of stock may not be the least liquid. In the context of restricted stocks of publicly traded companies, larger blocks might represent greater control. Conventional wisdom is that liquidity increases as control increases. Institutional investors may actually prefer larger blocks to smaller blocks of restricted stocks, which the SEC Rule 144 discussion of Section IV suggests. And, it likely is more economical to register large blocks than small blocks of restricted stock. The possible preference for large blocks of restricted stocks contradicts the method by which Pluris measures PEDI.
Regardless of the validity of the Pluris association of large blocks of restricted stock with small blocks of ownership in privately held businesses, making an addition to RSED such as adding a PEDI seems appropriate. The PEDI addition recognizes that the RSED calculation is based on public company transactions, and that there is a lesser marketability of interests in privately held businesses.
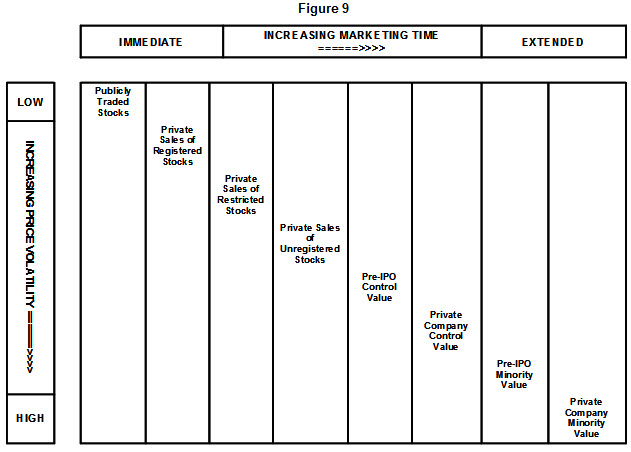
Figure 9, presents a relational stratification of the types of empirical studies that researchers have performed to explore the cost of illiquidity.[7] Figure 9 attempts to present the studies in relative position based on marketing time and price volatility—assuming all other characteristics of the investment are identical. The underlying assumption is that as investments in otherwise identical companies become more illiquid and decrease in control, they become riskier. That is, they take longer to sell and are subject to greater price variation. The presentation is instructive in enhancing understanding of what the various studies are measuring, how they relate to publicly traded values, and the extent to which they meet the needs of a business valuation. The PEDI concept is consistent with the Figure 9 depiction of incremental levels of discount that increase with sale/marketing-restriction periods and stock price volatility. Figure 9 demonstrates that PEDIs should increase as stocks become less liquid and/or are subject to greater price volatility relative to publicly traded stocks generally and relative to restricted stock transactions such as those comprising the Pluris DLOM Database.
Private sales of companies for which hypothetical buyer and sellers have no expectation of going public should be worth less than the restricted stock of an otherwise identical company that is public or has the anticipation of an IPO event. A PEDI is therefore an appropriate component of the DLOM applicable to an ownership interest in a private company. Non-controlling interests in private companies require even greater discounts because the risks associated with lacking control causes the periods of time needed to liquidate the position to be potentially much longer than for the controlling interest in the same company. The Pluris PEDI does not distinguish between controlling and non-controlling interests in privately held businesses. The latter requires a greater DLOM than the former in most circumstances.
As previously stated, Pluris calculates PEDI as the difference in the discounts observed for larger block and smaller block transactions.[8] The first step in this process is to compare the RSED of the largest block transactions with the average and median RSED indications for the entire database.[9] The Pluris calculator then uses a matrix that combines multiplicative and additive adjustments to the RSED to arrive at PEDI estimates.[10] The matrix calculates four values, but the calculator within the Pluris DLOM Database only averages the two middle values when computing a PEDI.[11] Therefore, the Pluris methodology ignores the possibility that the appropriate PEDI may be less than or greater than the average of the middle range of values.
Pluris claims that the excess discount of the largest restricted stock transactions (the least liquid blocks according to Pluris) over that of the population of transactions is analogous to the difference in discounts between public companies and private companies.[12] This analogy seems illogical. A 100% interest is the largest block of stock that one can own in a private company; with the Pluris logic, it should have the highest DLOM. Yet it is generally accepted that the DLOM applicable to a controlling interest should be less than that applicable to a non-controlling interest in the same company.
Additional problems with the way Pluris measures PEDI are that it presents no evidence that: (a) it actually takes longer to sell a larger than a smaller block of a public company’s restricted stock in a single private transaction; (b) there is greater price volatility exposure for larger blocks than smaller blocks of a public company’s restricted stock; or (c) size-percentage blocks of public companies’ restricted stocks are analogous to any particular size-percentage interests in privately held businesses. Therefore, although the concept of a PEDI is appropriate (i.e., an incremental discount relative to public company restricted stock discounts), the Pluris logic behind the methodology seems speculative and unreliable.
2.C. The Pluris Quartile Approach Creates Artificial DLOM Values
Pluris states that its purpose is providing users with a “determination of an appropriate marketability discount…based on actual transaction data, not on an opinion, prior court cases, or a median value from a smaller study.”[13] The Pluris methodology contradicts this purpose by explicitly calculating DLOM using just the median discounts of individual quartiles of data from its own, albeit larger, “study.” The analytical significance of the other transactional data is therefore essentially ignored.
DLOMs calculated using the Pluris methodologies do not directly reflect the observed discounts for the user-selected valuation parameters (i.e., a selected combination of the total assets, total revenues, EBITDA, net income, net profit margin, book equity, enterprise value, and the ratio of market value-to-book value). Instead, they reflect the median discount of the quartile of transaction data in which each parameter falls. The medians are then averaged. This method imposes an artificial floor and ceiling for the potential DLOM outcomes, as shown in Table 13 and Figures 10 and 11.
Using the valuation parameters reported in the Pluris DLOM Database, we calculated Pluris Method 1 and Method 2 DLOMs for the 3,581 restricted stock transactions in the database that had complete data for all eight of the standard input parameters of the Pluris database.[14] Our transaction selection for Method 1 was the entire database. Although Method 1 is intended for selection of specific transactions that the user considers comparable to the valuation subject, that concept is illogical if the valuation subject is the very transaction being used as the benchmark. Thus, our calculations of Methods 1 and 2 DLOMs merely measure the effects of the limitations that Pluris imposes on the Method 2 dataset. Table 13 shows that the difference is slight. See subsection 2.A. for more on this.
Table 13 summarizes the minimum, average, and maximum values for RSED, PEDI, and DLOM using Pluris RSED Methods 1 and 2 as described in the previous paragraph.
| Table 13 | ||||||
| Pluris Average DLOMs for 3,581 Restricted Stock Transactions | ||||||
| _____Method 1_____ | _____Method 2_____ | |||||
| RSED | PEDI | DLOM | RSED | PEDI | DLOM | |
| Minimum | 9.9% | 5.2% | 15.0% | 9.4% | 5.1% | 14.0% |
| Average | 21.2% | 7.2% | 28.4% | 20.4% | 7.1% | 27.5% |
| Maximum | 34.9% | 9.6% | 45.0% | 32.3% | 9.1% | 41.0% |
Figures 10 and 11 are histograms that show the frequency of occurrence of DLOMs calculated using RSED Methods 1 and 2, respectively.
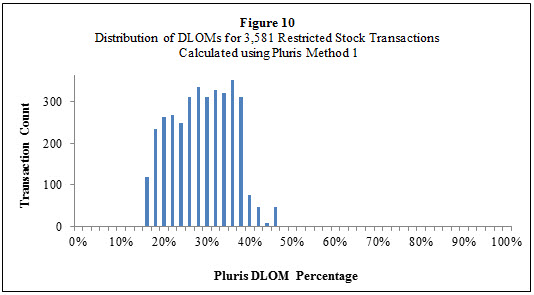
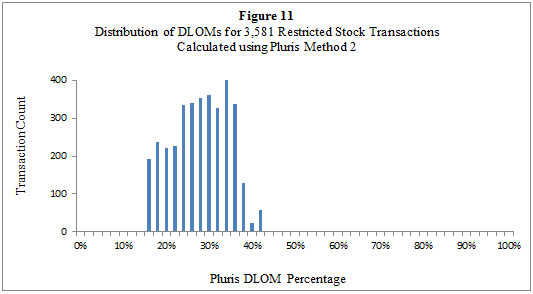
Relying on Pluris necessarily means that one is comfortable with the notion that all DLOMs fall within the range of fourteen percent and forty-five percent of the marketable value for all business valuation subjects. One should, instead, be uncomfortable with that notion considering the directly contradictory evidence of negative discounts and the broad range of discounts within the Pluris DLOM Database shown by Figures 12 and 12-A and predicted by Figure 14.
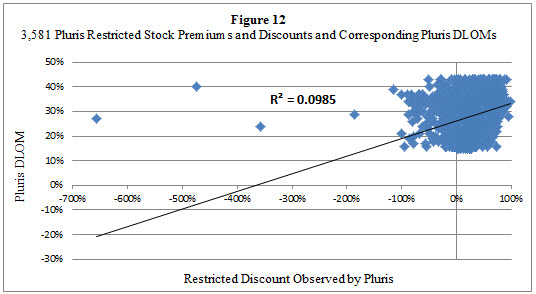
A matter that should be of great concern to practitioners is that DLOMs calculated using the Pluris methodologies do not correlate well with the discounts reported for the underlying restricted stock transactions. Figure 12 is a scatter graph of the restricted stock discounts reported in the Pluris DLOM Database and the average corresponding DLOMs of Methods 1 and 2.[15] Figure 12 presents the results for 3,581 database transactions for which all of the Pluris DLOM calculator parameters are present.[16] Figure 12 reports a 9.85% R-square of correlation between the calculated DLOMs and the observed discounts of the underlying transactions. This means that the Pluris methodology fails to explain over ninety percent of the variability of the observed discounts.
Pluris database Version 4.2.0 has 1,743 restricted stock transactions that have complete data for all eight of the specified parameters of the Pluris calculator, and that do not have warrants attached. Narrowing our calculations of Pluris DLOMs to just these transactions resulted in Figure 12-A. It shows a reduced R-square of correlation of just 6.45% between the average Method 1 and Method 2 DLOM and the corresponding discount that leaves almost ninety-four percent of the variability of the observed discounts unexplained.
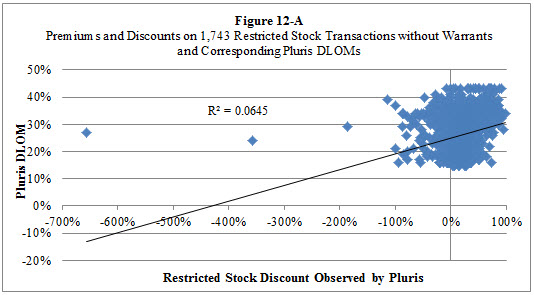
Figure 13 presents a scatter graph of a 3,149-transaction subset of those shown in Figure 12 that have discounts greater than zero. This dataset includes transactions with and without warrants. The R-square of correlation between the average of the Pluris Method 1 and Method 2 DLOMs increased to 27.1% for this population of transactions. Still, the Pluris DLOM methods fail to explain almost seventy-three percent of the variability of the discounts of the underlying transactions.
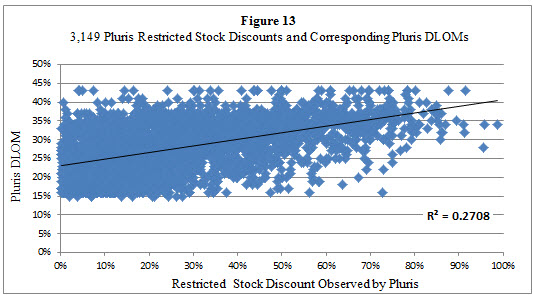
Figure 13-A presents a scatter graph of the 1,743-transactions shown in Figure 12-A that do not have warrants and have discounts greater than zero. As with the Figure 13 transactions, this sub-population exhibits an increased R-square of correlation—28.6%.
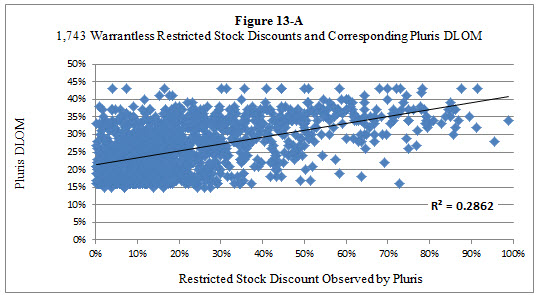
Of the 3,632 transactions in the full Pluris database, 1,019 report discounts above the 34.9% maximum RSED and 1,010 report discounts below the 9.4% minimum RSED calculated using the Pluris DLOM methodologies. See Table 13. Accordingly, the discounts reported for 2,029 transactions—fifty-six percent—fall outside the range of the RSED values calculated with the Pluris methodologies. This fact discloses a serious reliability problem for practitioners.Not surprisingly, Figures 12, 12-A, 13, and 13-A demonstrate a deterioration of correlation between the calculated DLOMs and populations of transactions that include negative discounts. The Figures also demonstrate the artificial ceiling and floor that the Pluris methodologies consistently impose on DLOMs regardless of the presence of negative discounts. Figures 12 and 12-A include many transactions with discounts of zero or less, but none of the calculated DLOMs are less than fourteen percent. And despite that many of the observed discounts are well above forty-five percent, the maximum DLOMs shown by all four Figures is below that percentage. The same is shown in Figures 13 and 13-A.
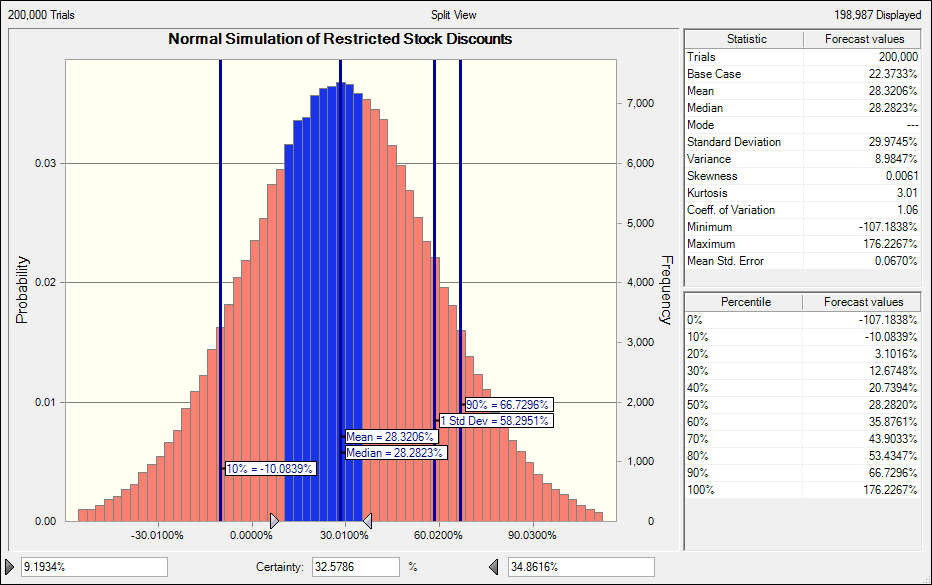
We used Oracle Corporation’s Crystal Ball software to evaluate the range of outcomes predicted by the discounts reported in the Pluris DLOM Database. The reported discounts have a statistical mean of 22.37% and a standard deviation of 29.91%.[17] We used these values as our assumptions for Monte Carlo simulations. The software performed 200,000-iteration normal (Figure 14) and log-normal (Figure 15) trials in each simulation.
The normal distribution simulation of Figure 14 resulted in a simulated mean of 28.32% and a simulated standard deviation of 29.97%. The simulation shows that the range of outcomes predicted by this mean and standard deviation of the discounts is from negative 107% to positive 176% of the publicly traded values. But, DLOM obviously cannot be less than zero percent nor greater than 100% of the publicly traded price.
The area in blue represents the range of RSED values calculated using the Pluris methods. The Pluris methods clearly do not predict negative values, a material inconsistency with the underlying data that appears to contradict the usefulness of the Pluris benchmarking methods for estimating DLOMs. Figure 14 shows that about sixty-seven percent of expected discounts would likely fall below the 9.4% minimum and above the 34.9% maximum RSEDs calculated using the Pluris methods. With a normal distribution assumption there is less than a thirty-three percent certainty that Pluris RSED methods will yield an accurate value relative to the discounts in the database.
Figure 14
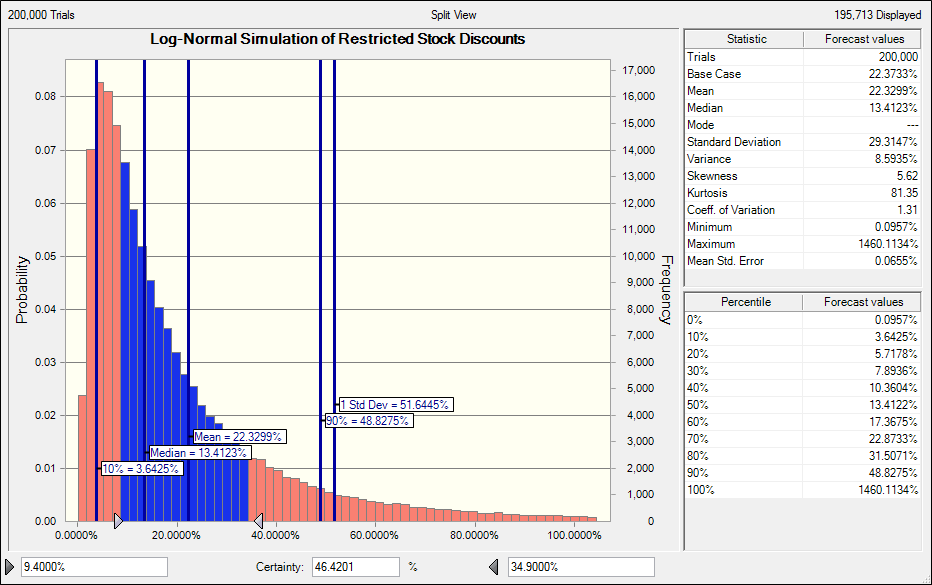
The restricted stock discounts can also be analyzed using a log-normal distribution assumption. The predicted discounts range from zero percent to 1,460%, which we show with Figure 15. Again, the area in blue represents the range of RSED values calculated using the Pluris methods. The log-normal assumption does not solve the problem of hundreds of actual transactions with negative discounts, but nonetheless, provides useful information by assuming that no forecasted value for DLOM purposes should be less than zero. The log-normal simulation of Figure 15 resulted in a simulated mean of 22.33% and a simulated standard deviation of 29.31% for the discounts of the transaction population. This simulation shows that about seventy percent of the predicted discounts fall below the predicted mean. This simulation also predicts that half of all discounts would fall below and above a 13.4% median of the distribution. The most frequently predicted discount is slightly above 3.6%—well below the minimum RSEDs calculated by Pluris. On the order of thirty-five percent of discounts are predicted to fall below the 9.4% minimum Pluris RSED and on the order of fifteen percent to fall above the RSED maximum of 34.9%. About fifty-four percent of expected discounts fall outside the range of RSEDs calculated using the Pluris methods under the log-normal assumption. See Table 13 and Figure 15. With a log-normal distribution assumption, there is only about a forty-six percent certainty that Pluris RSED methods yield DLOMs consistent with the restricted stock discounts against which they are benchmarked.
Figure 15
Section VIII
Conclusions
The Pluris DLOM Database includes a wealth of information. The data in the database appears to be good, but the data for specific transactions should be verified before relying on it. The values assigned to stock warrants should be independently evaluated before relying on restricted stock transactions that included warrants. The facts seem to indicate that Pluris may have overvalued the warrants, thereby overstating the observed discounts.
Statistical analysis does not support using the Pluris DLOM Database to directly benchmark a specific DLOM with one or more restricted stock transactions. This is because the population of observed restricted stock discounts seems to have little or no correlation with the reported financial metrics. It appears that only price volatility is a statistically significant predictor of the observed discounts.
DLOMs calculated using the Pluris DLOM methodology appear to be unreliable because of: 1) the lack of statistical significance of the eight primary benchmarking inputs with the observed discounts; 2) the exceptionally low R-squares of correlation of the eight primary and the other metrics reported by Pluris with the observed discounts; 3) questions regarding the discount measurements of restricted stock transactions that included warrants; 4) the artificial bracketing of DLOMs into a fourteen percent to forty-five percent range, while the observed discounts cover a far wider range of values that includes price premiums; 5) the reliance of the Pluris DLOM methodology on median data points that omits any meaningful influence of the distribution of the observed discounts that underlie the calculations; and, 6) the lack of correlation (based on this analysis) of Pluris DLOM results and the observed restricted stock discounts. Pluris method DLOMs calculated for 1,692 restricted stock transactions show an R-square of correlation of just twenty-five percent. This correlation appears to be the result of the artificial bracketing of DLOMs that occurs with the Pluris methodology.
The concept of a PEDI is valid, but the way Pluris calculates PEDIs is questionable. It is our opinion that PEDIs should be based on the incremental time and price volatility associated with marketing an illiquid asset versus the restricted stocks that comprise the Pluris DLOM Database.
Price volatility appears to be the only metric within the Pluris restricted stock database with a statistically significant underlying relationship with restricted stock discounts. Price risk also increases with time. DLOM estimation should therefore employ price volatility and time as primary metrics.
[1] http://www.valusource.com/Products/PlurisDLOM/FAQS.aspx.
[2] DLOM Database Webinar at https://www.youtube.com/watch?v=ndkowdw2aBU.
[3] See the discussion at the top of the “DLOMCALCULATION” tab of the Pluris spreadsheet download. We did not determine the number of exclusions that occur from these limitations.
[4] This is observed in the “RSED” tab of the Pluris spreadsheet download. The calculator also offers two input fields to accept parameters defined by the user. We ignore the custom fields in our discussion of the calculator methodology.
[5] That is, 3,632 transactions x 8 metrics = 29,056 – 8 medians = 29,048 transactions whose sole purpose is to establish a median.
[6] http://www.valusource.com/Products/PlurisDLOM/FAQS.aspx at paragraph 8.
[7] Figure 9 was originally presented in Marc Vianello’s paper entitled, “New Insight into Calculating Discounts for Lack of Marketability,” Financial Valuation and Litigation Expert, Issue 11, February/March 2008. The paper is available at http://www.vianello.biz/business_valuation_services.html, and provides additional discussion of Figure 1.
[8] http://www.valusource.com/Products/PlurisDLOM/FAQS.aspx.
[9] http://valusource.com/Files/PEDI_Calculation.pdf.
[10] Ibid.
[11] This is observed in the “PEDI” tab of the Pluris spreadsheet download.
[12] Pluris DLOM Database Webinar at https://www.youtube.com/watch?v=ndkowdw2aBU.
[13] http://www.pluris.com/pluris-dlom-database.
[14] Fifty-one of the 3,632 transactions in Version 4.2.0 of the Pluris DLOM Database do not have data for the valuation parameters used by the Pluris calculator. We excluded these transactions from the calculations summarized in Table 13.
[15] We elected to demonstrate the results using the average values calculated by Pluris Methods 1 and 2 because there is little difference between them. See Table 8.
[16] Figures 12 and 12-A show four and three transactions, respectively, with extremely negative discounts. These outliers are excluded in Figures 13 and 13-A along with all other negative discounts.
[17] Calculated from dlomWebExportData, Pluris DLOM Database Version 4.2.0.
[divide]
Marc Vianello, CPA, ABV, CFF is the Managing Member of Vianello Forensic Consulting, LLC. He is the inventor of the concept of probability-based discount for lack of marketability and is the developer of the VFC DLOM Calculator. Mr. Vianello has written extensively regarding DLOM, the time periods needed to sell privately held businesses, the specific company risks associated with abnormal debt levels, and adjusting cost of capital for prevailing market conditions. Mr. Vianello has testified extensively in Federal and State courts around the country in complex, high dollar financial litigation of all types, including valuation, intellectual property, breach of contract, and shareholder disputes, among others.
Mr. Vianello can be reached at (913) 432-1331 or by e-mail to vianello@vianello.biz.