A Critique of the Ibbotson Methodology
In this paper, the author argues that the Size Premium in Excess of CAPM (and other similar size premium measures) should not be used by valuation practitioners because: a) it is inconsistent with the empirical evidence; b) it is constructed using a method that is inconsistent with how practitioners estimate their CAPM cost of equity; and c) it does not properly calculate the “premium” for use in a Discounted Cash Flow (DCF) analysis. Through an illustration, the author also demonstrates the challenges one faces when correcting for the latter two issues.

[su_pullquote align=”right”]Resources:
Implied Private Company Pricing Line
Size Premium: Seductive Siren or DOA
The Three Valuation Approaches—Challenges and Issues
The Size Effect—It is Still Releveant
2017 Duff & Phelps Valuation Handbook—Guide to Cost of Capital
[/su_pullquote]
The Capital Asset Pricing Model (CAPM) is the most commonly used approach when calculating the cost of equity capital. However, the CAPM is not without its detractors. One of the frequently cited anomalies that question the validity of the CAPM is the existence of a size premium, which was first identified by Banz (1981).[1] Ibbotson Associates (Ibbotson), now Morningstar, extends Banz’s findings and publishes a “Size Premium in Excess of CAPM,” which Ibbotson claims could be used to construct a forward-looking cost of equity estimate for use in discounting future cash flows.[2] In general, the Size Premium in Excess of CAPM is purportedly the amount by which the expected return based on the CAPM underestimates the actual return of portfolios constructed based on size.
Reasons NOT to use the Size Premium in Excess of CAPM
As a result of Banz’s seminal paper and the work by Ibbotson, many practitioners add the Size Premium in Excess of CAPM to their CAPM cost of equity estimate.[3] In this paper, I argue that the Size Premium in Excess of CAPM (and other similar size premium measures)[4] should not be used by valuation practitioners because: a) it is inconsistent with the empirical evidence; b) it is constructed using a method that is inconsistent with how practitioners estimate their CAPM cost of equity; and c) it does not properly calculate the “premium” for use in a Discounted Cash Flow (DCF) analysis. Moreover, even if we ignore the empirical evidence contradicting the existence of a size premium, I contend that we cannot arrive at a reliable and robust estimate of the size premium even after correcting the Ibbotson methodology for the remaining two issues.
Sharpe (1964) gives us the following formula for the CAPM:[5]
![]()
where Ri is the expected return on subject firm i’s stock, Rf is the risk-free rate, b is the beta of subject firm i, and (Rm – Rf) is the difference between the market return and risk-free return or the equity risk premium (ERP). When Eq. (1) is augmented by the Size Premium in Excess of CAPM, SP, the formula becomes:
![]()
where SP is calculated as follows:[6]
A.1. Obtain value-weighted returns data for 10 size-based portfolios of stocks in the NYSE, AMEX, and NASDAQ with the largest 10 percent of stocks by market capitalization in Decile 1, and smallest 10 percent of stocks by market capitalization in Decile 10.
A. 2. Calculate the “Actual Return in Excess of the Riskless Rate” as the arithmetic mean return of each size-based portfolio less the income return on a 20-year government bond from 1926 to the last full calendar year prior to the publication of the Ibbotson Stocks, Bonds, Bills & Inflation (SBBI) Yearbook (e.g., 2015 Ibbotson SBBI Yearbook uses data through December 2014).
A.3. Estimate “Beta” by regressing the monthly return in excess of the 30-day U.S. Treasury bill on the S&P 500 return in excess of the 30-day U.S. Treasury bill from 1926 to the last full calendar year prior to the publication of the Ibbotson SBBI Yearbook.
A.4. Estimate the ERP as the arithmetic mean total return of the S&P 500 minus the arithmetic mean income return component of 20-year government bonds from 1926 to the last calendar year prior to the publication of the Ibbotson SBBI Yearbook.
A.5. Calculate the “CAPM Return in Excess of Riskless Rate” as the Beta in A.3 multiplied by the ERP in A.4.
A.6. The “Size Premium in Excess of CAPM” is equal to the Actual Return in Excess of the Riskless Rate in A.4 less the CAPM Return in Excess of Riskless Rate in A.5.
However, adding the Size Premium in Excess of CAPM to a practitioner’s CAPM cost of equity creates a flawed cost of equity estimate for at least three reasons. First, the empirical evidence that followed the seminal work by Banz provides contradictory evidence on the existence of a size premium. For example:
- Cochrane (2005) states: “Many of the anomalous risk premia seem to be declining over time. The small-firm effect completely disappeared in 1980; you can date this as the publication of the first small-firm effect papers or the founding of small-firm mutual funds that made diversified portfolios of small stocks available to average investors.”[7]
- Ang (2014) reports: “The size effect—that small stocks outperform large stocks—was brought to investors’ attention by Banz in 1981 and reached its peak after that…Since the mid-1980s, however, there has been no size premium after adjusting for market risk.”[8]
- Damodaran (2015) explains: “I have never used a small cap premium, [sic] when valuing a company and I don’t plan to start now. Needless to say, I am often asked to justify my non-use of a premium and here are my reasons. First, I am not convinced by either the historical data or by current market behavior that a small cap premium exists. Second, I do believe that small cap companies are more exposed to some risks than large cap companies but there are other more effective devices to bring these risks into valuation.”[9]
In spite of this evidence, proponents of adding a size premium typically cite Banz (1981), Reinganum (1981), and Fama and French (1993) as support for the existence of the size premium.[10] However, some academics have cautioned that the results of these papers may have been a product of data mining. For example, Ang (2014) explains:
“[T]he original discovery of the size premium could have just been data mining. Fisher Black (1993) made this comment immediately after Fama and French’s paper was released…One telling outcome of data mining is that an effect appears significant in sample, where the models are originally estimated, but it fails out of sample, where the models are tested after their discovery. Banz’s size effect, therefore, might never have truly existed in the first place, and its finding by Banz and Reinganum was pure luck.”[11]
Given the above, there is no basis to assume that a size premium exists, let alone assume that we have to augment the CAPM to account for it.
Second, although the Size Premium in Excess of CAPM is analogous to an “error” in a statistical sense, the Size Premium in Excess of CAPM is not arrived at using the same method by which practitioners estimate their CAPM cost of equity. We would be hard pressed to find a valuation conducted by a practitioner in which the beta is estimated using monthly returns from 1926 to the valuation date. Instead, practitioners often use estimation periods between two to five years preceding the valuation date when calculating beta. Consequently, the Size Premium in Excess of CAPM is no different than any arbitrary number added to the practitioners’ CAPM cost of equity estimate, as both would have no relation to how well or poorly the practitioner’s CAPM cost of equity approach estimates realized returns.
Finally, the Size Premium in Excess of CAPM does not appropriately measure the relevant “size premium” for use in a DCF analysis. Note that the CAPM is a one period model that describes the way investors form expectations one period ahead. Therefore, as an “error” that is applicable to a DCF analysis in which we discount future cash flows, the appropriate size premium has to measure by how much the expected return for the next year based on the CAPM understates or overstates the realized return for the next year, i.e., an out-of-sample test. By contrast, the Size Premium in Excess of CAPM calculates the difference in actual and expected returns over the same period, i.e., an in-sample test.
Attempt to Correct the Ibbotson Methodology
Even if we were convinced that a size premium is warranted to augment the CAPM cost of equity, we still have to correct the Ibbotson methodology to account for the last two issues described above. In an attempt to salvage the Ibbotson methodology, I construct a “Practitioner-Consistent Size Premium” using the following illustrative approach:[12]
B.1. Obtain 10 size-based value-weighted portfolio returns, ERP, and risk-free rate data. For purposes of this paper, we obtain all our data from Professor Kenneth French’s Data Library, which as of the time of the writing of this paper includes monthly data from July 1926 to November 2015. My choice of Professor French’s data is two-fold. First, the data is freely available and is updated regularly, so practitioners can use up-to-date data through the valuation date. Second, using an independent data source avoids any potential criticism in the construction of the size-based portfolios and the choice of inputs. Ultimately, a reliable and robust size premium should not be dependent on the data source used.
B.2. Calculate the “Realized Return in Excess of Riskless Rate” as the difference between the cumulative realized return over a 12-month period and the cumulative risk-free return over the same 12-month period.
B.3. Estimate the “Beta” for Decile 1 (largest firms) through Decile 10 (smallest firms) using three years of monthly returns using the CAPM (i.e., a regression of the excess portfolio return on the excess market return similar to A.3). The use of a three-year estimation period is in the middle of the two- to five-year estimation period typically used by practitioners and it is the method used by Yahoo Finance for the betas it reports on its website.
B.4. Estimate the ERP using at least 35 years of data, which means that we would have an estimate of the ERP each month beginning in June 1961 (i.e., the first 420-month period is from July 1926 to June 1961).[13] For each month that follows, the ERP estimate would incorporate more data, such that, by November 2014 (the last month used to calculate expected returns in our sample), we would have an ERP calculation based on data for each month from July 1926 to November 2014. The interquartile range (i.e., middle 50% of the data) of the ERP in our sample from June 1961 to November 2014 is 7.79% to 8.48%, which is consistent with the range of common estimates of the ERP.
B.5. Calculate the “Expected Return in Excess of Riskless Rate” as the product of the Beta in B.3 and the ERP in B.4.
B.6. The “Practitioner-Consistent Size Premium” is equal to the Realized Return in Excess of Riskless Rate in B.2 less the Expected Return in Excess of Riskless Rate in B.5. For example, the Practitioner-Consistent Size Premium for November 2015 is equal to the Realized Return from December 2014 to November 2015 less the Expected Return in Excess of Riskless Rate as of November 2014. This yields a full sample of Practitioner-Consistent Size Premium for each month from June 1962 to November 2015.
Table 1 reports the Practitioner-Consistent Size Premium averaged over the last 5, 15, 25, 35, and 53 years. Averaging over the last five years, we observe that Decile 10 (smallest stocks) values are marginally significant while Decile 1 (largest stocks) values are statistically significant. However, the Practitioner-Consistent Size Premium for Decile 1 is higher than that for Decile 10 (8.33% vs. 4.08%), which is inconsistent with the notion that smaller stocks have a higher risk-adjusted return than larger stocks. For the rest of the time periods, many of the values for the Practitioner-Consistent Size Premium are not statistically significant even at the 10% level. For example, averaging over the last 35 years, only Deciles 2 and 4 have statistically significant Practitioner-Consistent Size Premiums. Moreover, the apparent lack of a discernable pattern calls into question the Practitioner-Consistent Size Premium’s reliability and robustness.
As Table 2 confirms, for the most part, the interquartile range of each decile ranges from large negative values to large positive values. As a consequence, there is substantial overlap in the interquartile ranges of the different deciles. For example, using a 35-year average, the middle 50% of the data in Decile 1 range from -7% to -14%, while the middle 50% of the data in Decile 10 range from 14% to 14%. Such a huge overlap between the interquartile ranges of Decile 1 and Decile 10 make it difficult to reliably distinguish a Practitioner-Consistent Size Premium that should be in Decile 1 from a Practitioner-Consistent Size Premium that should be in Decile 10.
Even if we ignore the lack of statistical significance of the Practitioner-Consistent Size Premiums, the calculated values still generate inconsistent and unreliable results. Table 1 also shows that Decile 10 has a Practitioner-Consistent Size Premium smaller than most of the other deciles over an investment lifetime of 35 years. Indeed, only during the 15-year and 53-year averages does Decile 10 (smallest stocks) have the largest Practitioner-Consistent Size Premium and Decile 1 (largest stocks) have the smallest Practitioner-Consistent Size Premium. However, even during those scenarios, the Practitioner-Consistent Size Premium for the deciles in between Deciles 1 and 10 are not increasing as firm size is decreasing.
Table 1: Practitioner-Consistent Size Premium
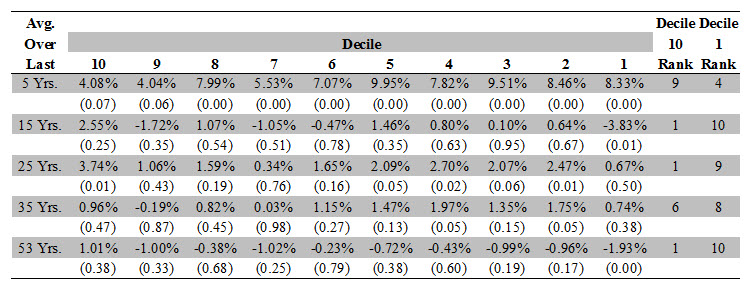
Notes: Data is from July 1926 to November 2015. Decile 1 is the decile of largest stocks and Decile 10 is the decile of smallest stocks. Values in parentheses are p-values. A rank of 1 denotes the largest value and a rank of 10 denotes the smallest value of the Practitioner Consistent Size Premium.
Source: Kenneth French’s Data Library, January 9, 2016.
Table 2: Interquartile Range of Practitioner-Consistent Size Premium
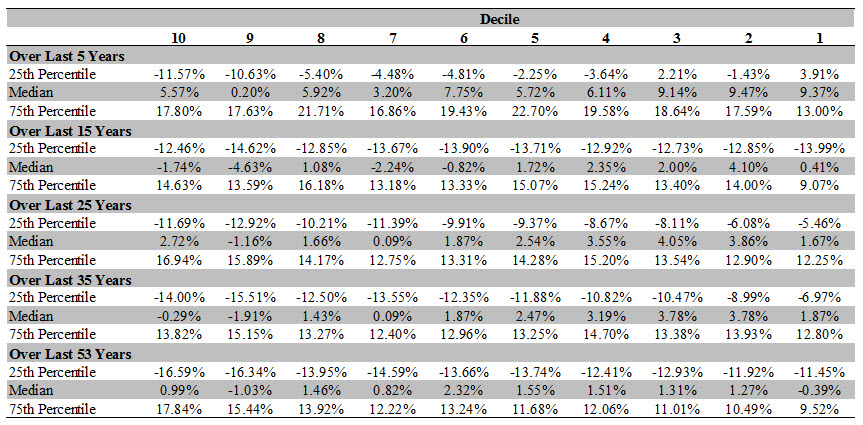
Notes: Data is from July 1926 to November 2015. Decile 1 is the decile of largest stocks and Decile 10 is the decile of smallest stocks.
Source: Kenneth French’s Data Library, January 9, 2016.
This inconsistency is not only a result of the illustrative approach I use as a similar inconsistency can also be observed in the original Ibbotson methodology. For example, the 2002 Ibbotson SBBI Yearbook reported Decile 6 had a size premium of 1.36% while Decile 7 had a size premium of 1.26%, the 2006 Ibbotson SBBI Yearbook reported Decile 6 had a size premium of 2.14% while Decile 7 had a size premium of 2.06%, and the 2015 Ibbotson SBBI Yearbook reported that Decile 5 had a size premium of 1.65% while Decile 6 had a size premium of 1.63%. Had the Ibbotson methodology been reliable and robust, we would observe that deciles with smaller firms would always have a larger Size Premium in Excess of CAPM than deciles with larger firms.
These results indicate that the Ibbotson size premium methodology, even when corrected to be consistent with how a valuation practitioner could calculate her CAPM cost of equity and to estimate the size premium as an out-of-sample “error,” still yields fundamentally inconsistent results. This inconsistency suggests that any support for adding a size premium to the CAPM cost of equity could be a result of crunching numbers until one finds assumptions, inputs, and a time period that works, i.e., data mining.
Conclusion
Given the above, we cannot conclude that a size premium still exists and, even if one were to assume its existence, we cannot reliably establish the magnitude of an appropriate size premium even for the smallest stocks. Consequently, there is no reliable basis for adding the Size Premium in Excess of CAPM to valuation practitioners’ CAPM cost of equity. Alternatively, valuation practitioners should instead consider adjusting the expected cash flows in the DCF analysis for whatever risk they believe the size premium may be reflecting.
* Vice President at Compass Lexecon. E-mail: cang@compasslexecon.com. Opinions expressed herein are solely those of the author and are not opinions of Compass Lexecon or its other employees. For his comments, I would like to thank Andrew Lin.
[1] R. Banz, 1981, “The Relationship Between Return and Market Value of Common Stocks,” Journal of Financial Economics, Vol. 9, 3-18.
[2] M. Barad, 2001, “Technical Analysis of the Size Premium,” retrieved on January 18, 2016 from https://corporate.morningstar.com/ib/documents/MethodologyDocuments/IBBAssociates/AnalysisSizePremium.pdf.
[3] C. Jones, 2010, Investments: Analysis and Management, 11th ed. (Wiley).
[4] Aside from Ibbotson, Duff & Phelps also reports an alternative calculation of the size premium in excess of CAPM. The major difference between the Ibbotson methodology and the Duff & Phelps methodology is that the latter uses data beginning in 1963 instead of 1926 and its beta is calculated using annual returns instead of monthly returns. Hence, all the criticisms of the Ibbotson methodology in this paper apply equally to the Duff & Phelps methodology.
[5] W. Sharpe, 1964, “Capital Asset Prices: A Theory of Equilibrium Under Conditions of Risk,” Journal of Finance, Vol. 19, No. 3, 425-442.
[6] Barad (2001) & Ibbotson SBBI 2015 Classic Yearbook.
[7] J. Cochrane, 2005, Asset Pricing: Revised Edition (Princeton University Press), p. 452.
[8] A. Ang, 2014, Asset Management: A Systematic Approach to Factor Investing (Oxford University Press), p. 457.
[9] A. Damodaran, 2015, “The Small Cap Premium: Where is the beef?,” Musings on Markets Blog at http://aswathdamodaran.blogspot.com/2015/04/the-small-cap-premium-fact-fiction-and.html retrieved on January 22, 2016.
[10] M. Reinganum, 1981, “The Anomalous Stock Market Behavior of Small Firms in January,” Journal of Financial Economics, Vol. 12, 89-104 & E. Fama and K. French, 1993, “Common Risk Factors in the Returns on Stocks and Bonds,” Journal of Financial Economics, Vol. 33, 3-56.
[11] A. Ang, 2014, Asset Management: A Systematic Approach to Factor Investing (Oxford University Press), p. 229.
[12] The inputs and assumptions used in this example are merely illustrative of a potential methodology that a valuation practitioner could use at arriving at the CAPM cost of equity. The concept I describe can be modified to use any input and assumption the valuation practitioner uses such that she can calculate the appropriate “error” that is consistent with the CAPM cost of equity approach she utilizes.
[13] The 35-year period is based on the length of an “investment lifetime.” See, for example, https://www.dimensional.com/famafrench/questions-answers/qa-small-stocks-for-the-long-run.aspx.
[divide]
Clifford S. Ang, CFA is Vice President at Compass Lexecon, an economic consulting firm that specializes in the application of economics to a variety of legal and regulatory issues. He works out of the Chicago, IL and Oakland, CA offices. Mr. Ang specializes in the areas of valuation, corporate finance, accounting, and damages. He has worked on hundreds of engagements involving companies across a broad-spectrum of industries concerning issues such as valuation, solvency, market efficiency, materiality, loss causation, and damages. Mr. Ang is also the author of Analyzing Financial Data and Implementing Financial Models Using R.
Mr. Ang can be reached at (510) 285-1285 or by e-mail to cang@compasslexecon.com.