Asset Values (Part II of III)
This is the second of a three-part article that focuses on valuing nonprofit corporation assets. Valuation analysts are commonly engaged to provide fair market value guidance related to nonprofit business transactions. Nonprofit businesses are often involved in arms-length transactions. Common transactions include royalty payments for the use of intellectual property, royalty revenue earned by licensing intellectual property, sales of assets, and purchases of assets. If the subject transaction is between a nonprofit and a related party, the transaction is required to be a fair market value transaction. This series provides an example of certain steps and procedures that can be used to value the assets of a nonprofit business.

[su_pullquote align=”right”]Resources:
Estimating Nonprofit Corporation Asset Values (Part I of III)
[/su_pullquote]
Calculating the Present Value Discount Rate
For this example, a weighted average cost of capital (WACC) was used as the Net Nonprofit Corporation (the Company or NNC) present value discount rate or required rate of return. This rate of return calculation provides an estimate of the required return a for-profit investor would expect to earn on an investment in the overall NNC business enterprise and in the NNC trademark intangible asset, as if NNC was treated as a for-profit entity.
Exhibit 4 presents the hypothetical NNC cost of equity calculation. For this example, the NNC cost of equity capital was estimated using the build-up rate model.

In this table, to estimate the cost of equity capital using the build-up rate model, the following components were added together: (1) the risk-free rate of return of 2.6 percent, (2) the general equity risk premium of 6.0 percent, (3) the industry-related equity risk premium of 0.3 percent, and (4) the size-related equity risk premium of 5.4 percent.
Based on the build-up rate model calculation, a cost of equity capital of 14.3 percent was estimated, as of the Valuation Date.
Rate of Return on Interest-Bearing Debt
For this example, the pretax cost of debt of 4.2 percent was used. That debt rate was based on the Moody’s Baa corporate bond rate as of the Valuation Date. The next procedure was to calculate the after-tax cost of debt capital by tax affecting the pretax cost of debt (i.e., multiplying it by 1 minus the blended income tax rate of 30.0 percent), to account for the tax deductibility of interest payments.
Based on the analysis, the after-tax cost of debt capital for NNC is 2.9 percent.
Weightings of Capital Components
Next, an equity capital structure of 90.0 percent and a debt capital structure of 10.0 percent was applied. The selected capital structure was based on the average of (1) the guideline publicly traded companies’ capital structure and (2) the industry capital structure median indications as presented in the 2017 Valuation Handbook: U.S. Industry Cost of Capital.
Weighted Average Cost of Capital
Using (1) an estimated required rate of return on equity capital of 14.3 percent, (2) an estimated after-tax cost of debt capital of 2.9 percent, and (3) a capital structure mix of 90.0 percent equity and 10.0 percent debt, a WACC of 13.0 percent (rounded) was calculated.
Group 1—NNC Trademark Conclusion
Exhibit 5 presents the NNC trademark analysis conclusion.

Based on this example, the indicated total present value of the NNC trademark is approximately $14.2 million prior to the application of the income tax amortization benefit.
The income tax amortization benefit was calculated and represents the net present value of the income tax savings resulting from the amortization of the NNC trademark value over a 15-year period to be $2.3 million.
The income tax amortization benefit was added to the indicated total present value of the NNC trademark to yield an indicated fair market value of the NNC trademark.
Based on the application of the relief from royalty method, the indicated fair market value of the NNC trademark is $16.5 million. Based on the application of the CUT method, a 5.0 percent arm’s-length royalty rate was estimated.
Customer Relationships—Consumer
Exhibit 6 presents the fair market value analysis of the NNC consumer customer relationships. For this example, the multi-period excess earnings method (MPEEM) was applied to estimate the fair market value of the consumer customer relationships.
Under this income approach method, the fair market value of the consumer customer relationships is estimated by calculating the present value of the net cash flow attributed to the customers over their expected RUL, which is expected to decay over time.
Based on discussions with management, and the analysis of company-prepared financial statements, a 2.5 percent customer attrition rate was selected. The customer attrition rate of 2.5 percent was then applied to projected revenue on an annual basis. Starting at the total revenue in year 1, the prior year’s revenue decreased by the 2.5 percent attrition rate per year.
The next analysis procedure was to estimate the servicing costs needed to generate the surviving customer revenue after attrition. Based on an analysis of publicly traded guideline companies, an operating income margin of 15.0 percent was applied to the total customer revenue after attrition in order to estimate the operating income from existing customers.
Since NNC is a nonprofit company, its actual operating income margin is not at a market level of operating income margin based on its “revenues.” However, the NNC consumer customer relationships was valued based on the hypothetical condition of treating NNC as a for-profit business, instead of the nonprofit nature of the NNC operating business. Therefore, the operating income margin was selected based on observed guideline publicly traded companies operating income margins, which represents market level profit margins.
In the next procedure, a royalty expense was subtracted, which was based on a 5.0 percent royalty rate for the NNC trademark. This procedure was necessary to directly account for the economic charge or required return related to the NNC trademark.

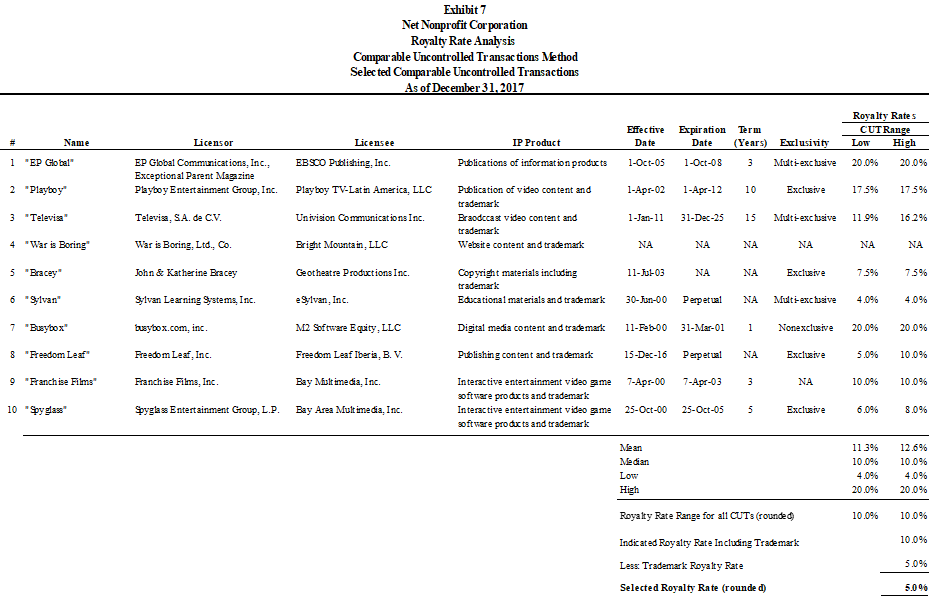
Since some of Group 3 content is delivered to NNC customers, an economic charge was applied for these intangible assets. Therefore, an economic charge of 5.0 percent was subtracted for the educational reviews and media content. On Exhibit 7 the CUTs considered and used to support the 5.0 percent economic charge selection are presented.
The analysis of existing customers included an estimate of avoided marketing costs. These marketing costs are typical costs related to new customer development rather than the servicing of existing customers. Company management estimated these expenses to be 5.0 percent of customer revenue after attrition.
After making the above-mentioned adjustments to operating income, an income tax rate of 30.0 percent was applied to the projected economic income to arrive at the after-tax economic income before contributory asset charges.
For the next procedure, the after-tax economic income was reduced for contributory asset charges. The after-tax income attributable to the consumer customer relationships was reduced by the estimated required return on (1) operating net working capital (not including cash and short-term investment assets) and (2) net fixed assets. These contributory assets are assumed to be in place and used throughout the projection period.
The contributory asset charge equates to the market-derived return on the tangible and intangible assets that are used or used up in the production of the economic income generated from the subject customer relationships.
In order to estimate the contributory asset charge, the required rates of return for each of the identified assets were estimated. The NNC trademark and the Group 3 content were not included as part of the contributory asset charge because the economic costs related to those assets were separately subtracted from operating income, as described above.
Net working capital is less liquid than cash, but more liquid and, therefore, less risky, than other long-term assets or fixed assets. The required rate of return for net working capital is estimated to be less than that of the other NNC asset classes. The required rate of return for the net working capital is estimated to be 5.2 percent, which equates to a weighted average return using (1) 80.0 percent of the Company cost of debt capital and (2) 20.0 percent of the Company cost of equity capital.
Next, it was estimated that the Company’s fixed assets would be financed with a combination of debt and equity capital. Since fixed assets are long-term assets and less liquid than working capital, the required return for fixed assets was estimated to be higher than the return on working capital. Accordingly, the weighted average required rate of return on the fixed assets was estimated to be 6.3 percent, which equates to a weighted average return using (1) 70.0 percent of the Company cost of debt capital and (2) 30.0 percent of the Company cost of equity capital.
For this example, it is necessary to multiply (1) the required rate of return for each asset class by (2) the estimated fair market value of each asset class to arrive at the contributory asset charge to be used in the MPEEM. This calculation resulted in a contributory asset charge of $75,000 in year 1 of the projection period, or approximately 0.56 percent of the estimated total revenue from the remaining customer base. In years 2 through 19, it was estimated that the contributory asset charge would remain at approximately 0.56 percent of the projected revenue from the remaining customer base.
After adjusting the projected economic income to reflect the contributory assets charge, the projected cash flow was discounted to a present value using a present value discount rate of 13.0 percent. The selected present value discount rate of 13.0 percent is equal to the WACC and considers (1) the consumer customer relationships intangible asset compared to the other intangible assets, (2) the estimate of the required rate of return on each of the acquired categories of assets, and (3) the evaluation of the risk of the remaining consumer customer financial projections.
Group 2—Customer Relationships Conclusion
Based on the analysis, the indicated total present value of economic income for the customer relationships is approximately $7.2 million prior to the application of the income tax amortization benefit.
The income tax amortization benefit was calculated and represents the net present value of the income tax savings resulting from the amortization of the customer relationships value over a 15-year period to be $1.1 million.
The income tax amortization benefit was added to the indicated total present value of economic income for the customer relationships to yield an indicated fair market value of the customer relationships.
Based on the analysis, the indicated fair market value of the customer relationships, using the MPEEM, is $8.3 million, as presented in Exhibit 6.
Group 2—NNC Software Delivery Platform
The NNC network has been expanded by the NNC education team. Approximately 10,000 schools use the NNC education content. The success the Company has enjoyed in building such a large network is due to the development of an effective delivery platform that delivers the education content to the network of schools and teachers. The education content that NNC has developed is comprised of (1) scientific reviews and analysis and (2) the development of its own curriculum for scientific applications.
Since revenue is not directly generated from the delivery platform, the reproduction cost new less depreciation (RCNLD) method was applied to estimate the value of the delivery platform.
The RCNLD method involves estimating the cost to construct, at current prices, an exact duplicate of the subject intangible asset, using the same materials, production standards, design, layout, and quality of workmanship as the subject intangible asset. The reproduced intangible asset will include the same inadequacies, superadequacies, and obsolescence as the subject intangible asset.
The components of cost involved in the RCNLD method are:
- Direct labor costs;
- Nonlabor, indirect materials, and overhead costs;
- Developer’s profit;
- Entrepreneurial incentive; and
- Depreciation and obsolescence.
NNC management provided the cost information required to reproduce the software delivery platform. These costs were direct labor base salary costs of all the NNC employees required to reproduce the delivery platform, an allocation of benefits costs, an allocation of nonlabor and overhead costs, and the level of effort in number of weeks. The total of these costs was $6.1 million as presented in Exhibit 8.

Developer’s Profit
The developer of any intangible asset expects to be reimbursed for all the costs that were incurred in the technology development phase in addition to receiving a profit or return on these costs. In other words, the developer expects (1) a return of all the material, labor, and overhead costs incurred and (2) a profit or return on all the material, labor, and overhead costs incurred.
Developer’s Profit Based on Public Company Profit Margins
Estimating a reasonable return on costs can be accomplished by searching for companies in the same industry with personnel or departments housing the same requisite skills involved as NNC. Examining the profit margins of the guideline publicly traded companies provides a reasonable estimate of rates of returns on costs. The developer would expect to achieve returns that are competitive with the returns these companies earn. Otherwise, the developer would not consider entering into the development process.
Based on the examination of the cost of equity capital calculation using guideline publicly traded companies, the appropriate return on costs is estimated to be 13.0 percent.
In addition to the developer’s profit, the owner of an intangible asset expects to earn an additional economic benefit as motivation to enter the development process. There are two components to the entrepreneurial incentive: (1) opportunity costs and (2) risk.
The opportunity costs relate to the time and resources the intangible asset owner would expect to invest in order to develop the intangible asset. These are costs because the time and resources could have been diverted to other investments or projects that already generate profits. The span of time measured in the opportunity costs start from the inception of the original intellectual content of the intangible asset to the point after its commercialization when the returns would be comparable to those of the other investments or projects.
The intangible asset owner would also expect an economic benefit commensurate with the risk characteristics of the project. If there is uncertainty that the project would be successful and generate profits, then the entrepreneurial incentive is in addition to the opportunity costs that provide motivation to the intangible asset owner to enter the development process.
The entrepreneurial incentive is estimated to be a 200-basis point premium to the developer’s profit.
The combined developer’s profit and entrepreneurial incentive expected rate of return of 15.0 percent was then applied to the total costs to reproduce the delivery platform. This resulted in an expected rate of return of $908,000 as presented in Exhibit 8.
The software delivery platform costs and expected rates of returns by themselves do not result in a value indication. In order to arrive at a value indication, the intangible asset must be adjusted for depreciation and obsolescence. Since the software delivery platform would be reproduced new, there would be no applicable depreciation.
There are three forms of obsolescence: (1) physical deterioration, (2) functional obsolescence, and (3) technological obsolescence.
Physical deterioration is the reduction of intangible asset value due to physical wear and tear resulting from continued use. This type of obsolescence is not applicable to the software delivery platform.
Functional obsolescence is the reduction of intangible asset value due to its inability to perform the function, or yield the economic utility, for which it was originally designed. The delivery platform is regularly being upgraded for the latest improvement in technology and know-how. Therefore, its functionality is not obsolete. Technological obsolescence is a type of functional obsolescence.
Technological obsolescence decreases intangible asset value due to improvements in technology that make the actual asset less than the ideal replacement for itself. As in the case of functional obsolescence, since the delivery platform is regularly being upgraded for the latest improvement in technology and know-how, technological obsolescence is not applicable to the reproduced delivery platform.
Group 2—Software Delivery Platform Conclusion
Based on the analysis, the indicated total present value of the software delivery platform is approximately $7.0 million prior to the application of the income tax amortization benefit, as presented in Exhibit 8.
The income tax amortization benefit was then calculated and represents the net present value of the income tax savings resulting from the amortization of the delivery platform value over a 15-year period to be $1.1 million.
The income tax amortization benefit was then added to the indicated total present value of the delivery platform to yield an indicated fair market value of the delivery platform.
Based on the analysis, the indicated fair market value of the software delivery platform, using the RCNLD method, is $8.1 million, as presented in Exhibit 8.
Group 3—Educational Related Content
The education related content consists of 1,000 titles of education curricula. NNC has built up this education-related content since 2012. Over this period, NNC developed an average 200 titles per year of scientific education-related ratings content.
The RCNLD method was applied to estimate the value of the scientific education related content. Exhibit 9 presents the RCNLD method application to estimate the value of the scientific education related content.

The following are the key inputs for the education content, these key inputs are similar to the detailed discussion of the Group 2 inputs previously discussed:
- The total annual costs to reproduce the education content is $3.1 million.
- The number of titles reproduced annually is 200.
- The annual reproduction cost per title is approximate $15,700.
- The total number of titles in the NNC library is 1,000.
- Estimated total reproduction cost new of $15.7 million.
- In same manner as applied in the Group 2 analysis, a combined developer’s profit and entrepreneurial incentive of 15.0 percent was applied.
- This resulted in an expected return based on the combined developer’s profit and entrepreneurial incentive of $2.4 million and an estimated indicated fair market value before depreciation and obsolescence of $18.0 million.
- The first method of estimating functional obsolescence resulted in a functional obsolescence estimate of 20 percent.
- The second method of estimating functional obsolescence resulted in a functional obsolescence estimate of 26 percent.
- A functional obsolescence estimate of 20 percent was selected and applied to the education content.
This article was previously published in, Willamette Insights, Spring 2019, titled “Fair Market Value Valuations of Not-for Profit Entity Property Transfers”, and is republished here with permission.
Kevin M. Zanni, ASA, CVA, CBA, CFE, CEIV, is a Managing Director at Willamette Management Associates in the firm’s Chicago office. He provides taxation valuation opinions, litigation valuation and damages opinions, fair value valuation opinions, transactional fairness opinions, and solvency opinions. He is the past president of the Chicago Chapter of the American Society of Appraiser and the current president of the Business Valuation Association of Chicago.
Mr. Zanni can be contacted at (773) 399-4333 or by e-mail to kmzanni@willamette.com.