
To evaluate future risk factors, analysts should understand the composition of the risk-free rate and consider the data influencing U.S. Treasury Bond yields. This article analyzes the criteria for evaluating the risk-free rate for use in engagements involving business valuations and economic damages.
The general notion of a “risk-free rate” is the return available as of the valuation date on a security that the market generally regards as free of the risk of default.[1] U.S. Treasuries have fit this profile for decades, providing minimum, safe alternatives for risk-averse investors. They also provide a building block for many valuation models. To evaluate future risk factors, analysts should understand the composition of the risk-free rate and consider the data influencing U.S. Treasury Bond yields. This article analyzes the criteria for evaluating the risk-free rate for use in engagements involving business valuations and economic damages.
Prior to the Great Recession of 2008, the valuation community considered the spot rate for U.S. Treasury Bonds to be an acceptable proxy for the risk-free rate. The spot rate is the price for immediate settlement of a commodity, currency, or other asset. This changed during the Great Recession, when spot rates declined relative to longer-term average rates. Recommendations[2] for adjusting the risk-free rate upwards made a lot of sense; otherwise lower rates would mean higher values, counterintuitive during a recession.
The concept of normalized[3] rates became de rigueur after the Great Recession, with terms such as “recommended”[4], “synthetic”[5], “substitute”[6], and “smoothed”[7] appearing in the valuation literature. It is time to revisit whether the logic for adjusting or normalizing the spot rate is still appropriate.
Risk-Free Rate Components
The so-called risk-free rate reflects three components:[8]
- Rental rate: A real return for lending the funds over the investment period, foregoing consumption for which the funds could otherwise be used.
- Inflation: The expected rate of inflation over the term of the risk-free investment.
- Maturity risk or investment rate risk: The risk that the principal’s market value will rise or fall during the period to maturity, as a function of changes in the general level of interest rates.
For an investment to be risk-free, it has to meet two conditions. First, there can be no risk of default associated with its cash flows. Second, there can be no reinvestment risk in the investment.[9] U.S. Treasuries are relatively risk-free, only in comparison to other sovereign bonds.
The above components are not segregated in the published data. By removing inflation, the combined rental rate and maturity risk can be quantified. This is shown in the following CPI table:[10]

The above data shows, on average, inflation of 2.6% annually since 2009. The Livingston Survey and Congressional Budget Office’s (CBO) long-term inflation outlook for the next 10 years are both approximately 2.3%[11], implying continued erosion of purchasing power.
Subtracting inflation from the risk-free rate results in the combined rental and maturity risk. This is shown in the following table for the above 2009–2025 period, as well as looking forward:

Assuming no reinvestment risk, the rent portion of the above yield would comprise the entire excess over inflation. Practically speaking, however, any expected changes in market yields during the holding period would be priced into the data. The historical information shows the residual risk was 0.5%, while the forward-looking column indicates 2.4% excess over inflation for the next 10 years. Either there is a mismatch with the rental component or the maturity risk is increasing.
Normalization Process
The process of normalizing the risk-free rate is designed to reflect a sustainable average expected return on a U.S. government bond.[12] In other words, one normalizes the rate if the expert determines the spot rate is not reflective of future expectations. Analysts opting to adjust the risk-free rate should expect scrutiny regarding the basis of selection and methodology used.
In 2008, Kroll began issuing recommendations for the risk-free rate.[13] The following chart summarizes its recommended risk-free rates for 2011–2025:
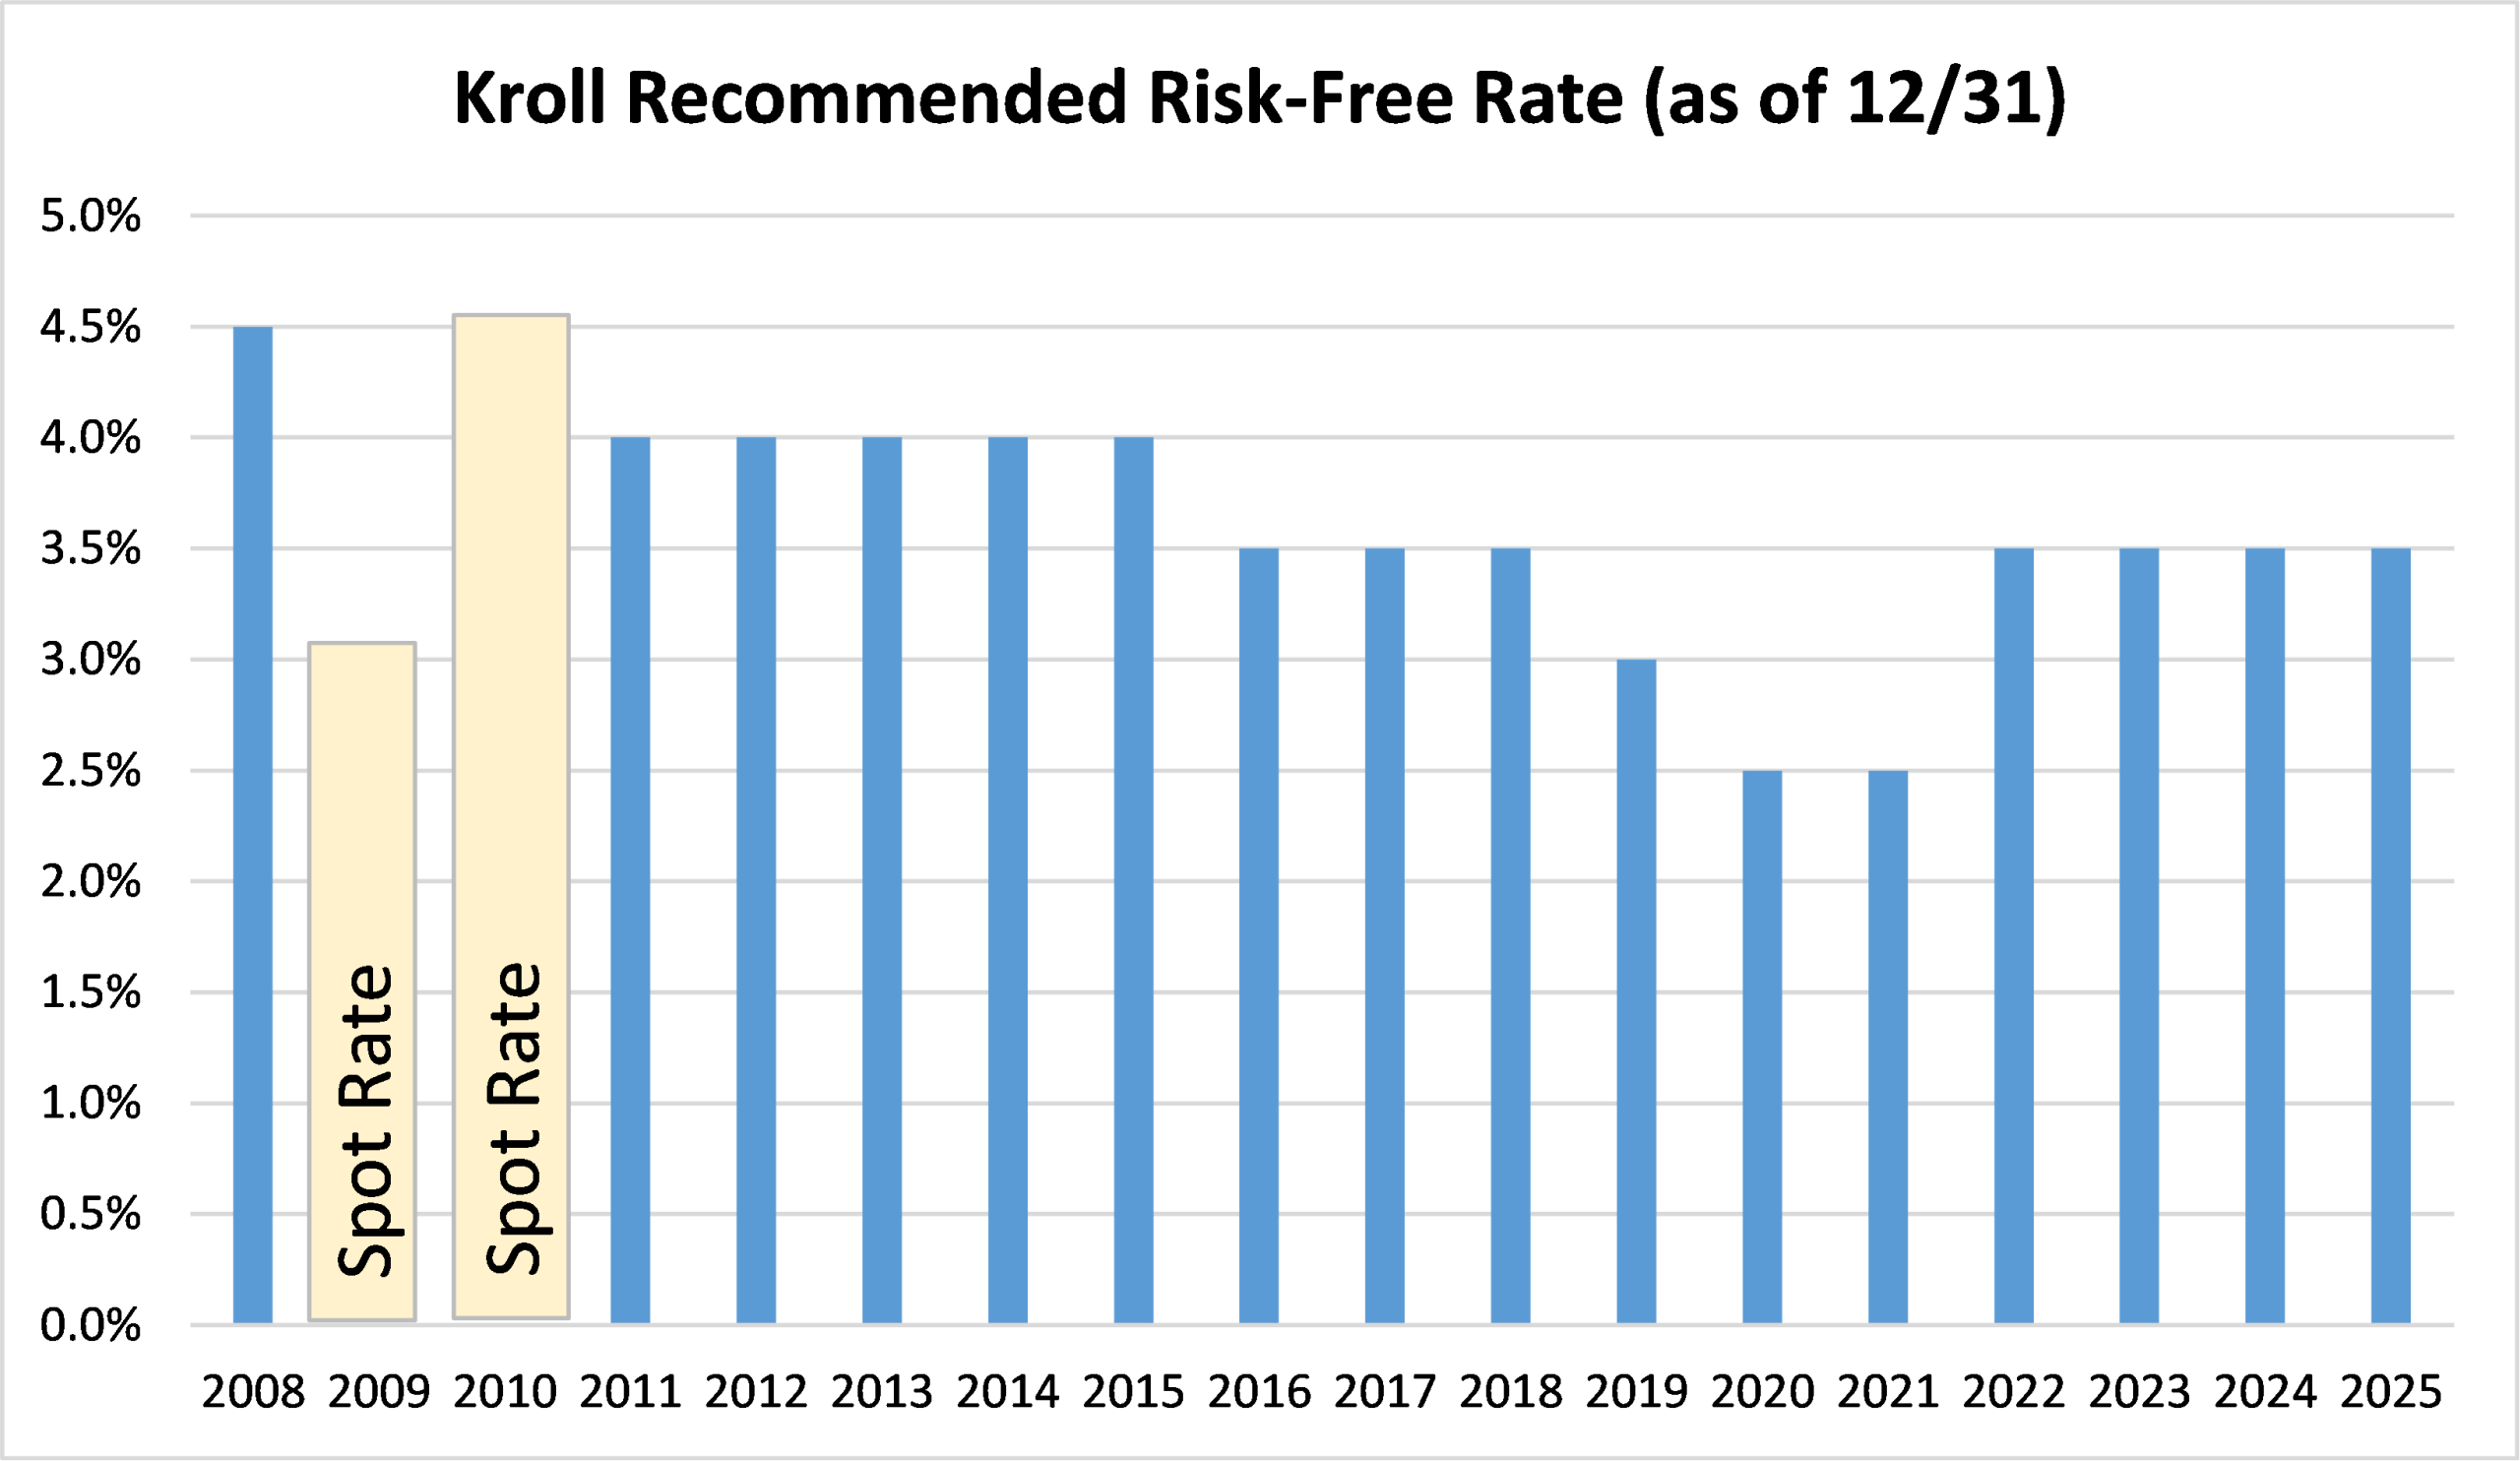
As shown above, the recommendations ratably declined from 4.5% in 2008 to a low of 2.5% in 2020–2021. The recommendations approximated the 10-year trailing historical averages and are a “simple way” of normalizing the risk-free rate.[14] In 2022, Kroll recommended the risk-free rate be the greater of the spot rate or 3.5%. This guidance remains in force today, in most circumstances preferring the spot yield.
For analysts choosing the spot rate, the decision may be as straightforward as choosing between T-bills and treasury bonds. The rates for U.S. treasuries are published daily and looking up the rate is required due diligence for every engagement. The 10- or 20-year bonds are commonly used for business valuations when matching cash flows into perpetuity.[15]
For a “normalized” risk-free rate determination, valuation analysts should be able to explain the factors warranting a departure from the spot rate. Considerations may include inflation, the time span of historical averages, and other factors.
Perhaps the selection of the risk-free rate is not an either-or determination between the spot and “normalized” rate. Professional judgement allows the analyst to show both figures (normalized and spot) and conclude on the resulting range of values.[16]
Which Historical Average?
Picking a historical average sounds easy until we look under the hood. The following chart shows the 20-year government bond yields since 1962.[17]
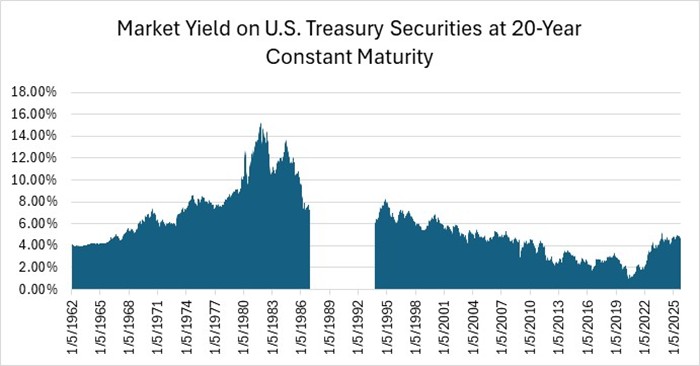
Most people will notice something is missing from the above picture. The gap in data between January 1987 and September 1993 creates a dilemma—how to forecast from an incomplete data set. Ignoring the omission means the foundation for projecting the “sustainable average” is flawed. For this reason, many analysts expand the time frame of historical data to minimize the effect on the overall outcome, or they opt for the 10-year rates.
Note also the above yields trended downward beginning in the 1980s and bottomed out during the pandemic (0.99% in August of 2020). The spot rates rebounded to 4.6% as of October 10, 2025, exceeding those during the Great Recession timeframe, when normalization discussions started.[18] The 4.6% yield remains lower than the 1962–2025 average of 5.9%,[19] although it is still within one standard deviation. Depending on the time-period used to select a “normalized” rate, the effect on valuations may vary widely.
Time Span of Historical Averages
The expert should select the rate that mirrors the time span for the expected cash flows as of the measurement date. This ensures consistency between the future benefits and risks assessed. For example, a lost profits claim lasting approximately six months should be matched to the corresponding T-bill yield for the same duration. The longer the forecast period, the more difficult the predictive ability becomes.
The Center for Research in Security Prices (CRSP) chose 1926 as the starting point for its data series due to the availability of higher quality data and to capture one full business cycle before the 1929 market crash. However, the Federal Reserve was formed in 1913, in response to the Panic of 1907, to provide a more stable monetary and financial system.[20] Using a dataset of the entire period of government’s active management of interest rates makes sense.
One notable court case highlights the thoughtfulness required for selecting an average to normalize the risk-free rate. In Global GT, the Delaware Chancery said 1926 has no magic as a starting point for estimating long-term returns.[21] With this in mind, let’s review the pros and cons of selecting various historical periods to average:
|
1926–2025 |
1962–2025 |
2009–2025 |
|
Pros: |
|
|
|
Generally accepted by the valuation community. |
Generally accepted by the valuation community. |
This period represents recent economic conditions such as the Great Recession and COVID-19 pandemic. |
|
Large sample size reduces effects of outliers. |
Large sample size reduces effects of outliers. Data can be analyzed on daily, weekly, monthly, or annual basis.[22] |
Data can be analyzed on daily, weekly, monthly, or annual basis. |
|
Cons: |
||
|
Missing data from 1987–1993 and daily/monthly data may be unavailable. |
Missing data from 1987–1993. Nasdaq information excluded until 1971. |
The average is lower than the recommended rates and historical averages. |
|
Past may not reflect the future. |
Past may not reflect the future. |
Past may not reflect the future. Duration may be perceived as insufficient to estimate market expectations. |
Recall the earlier observation that Kroll appeared to be using the 10-year trailing average for their recommended rates, implying that current conditions were more relevant.
Other factors to consider in the time span determination include the following:
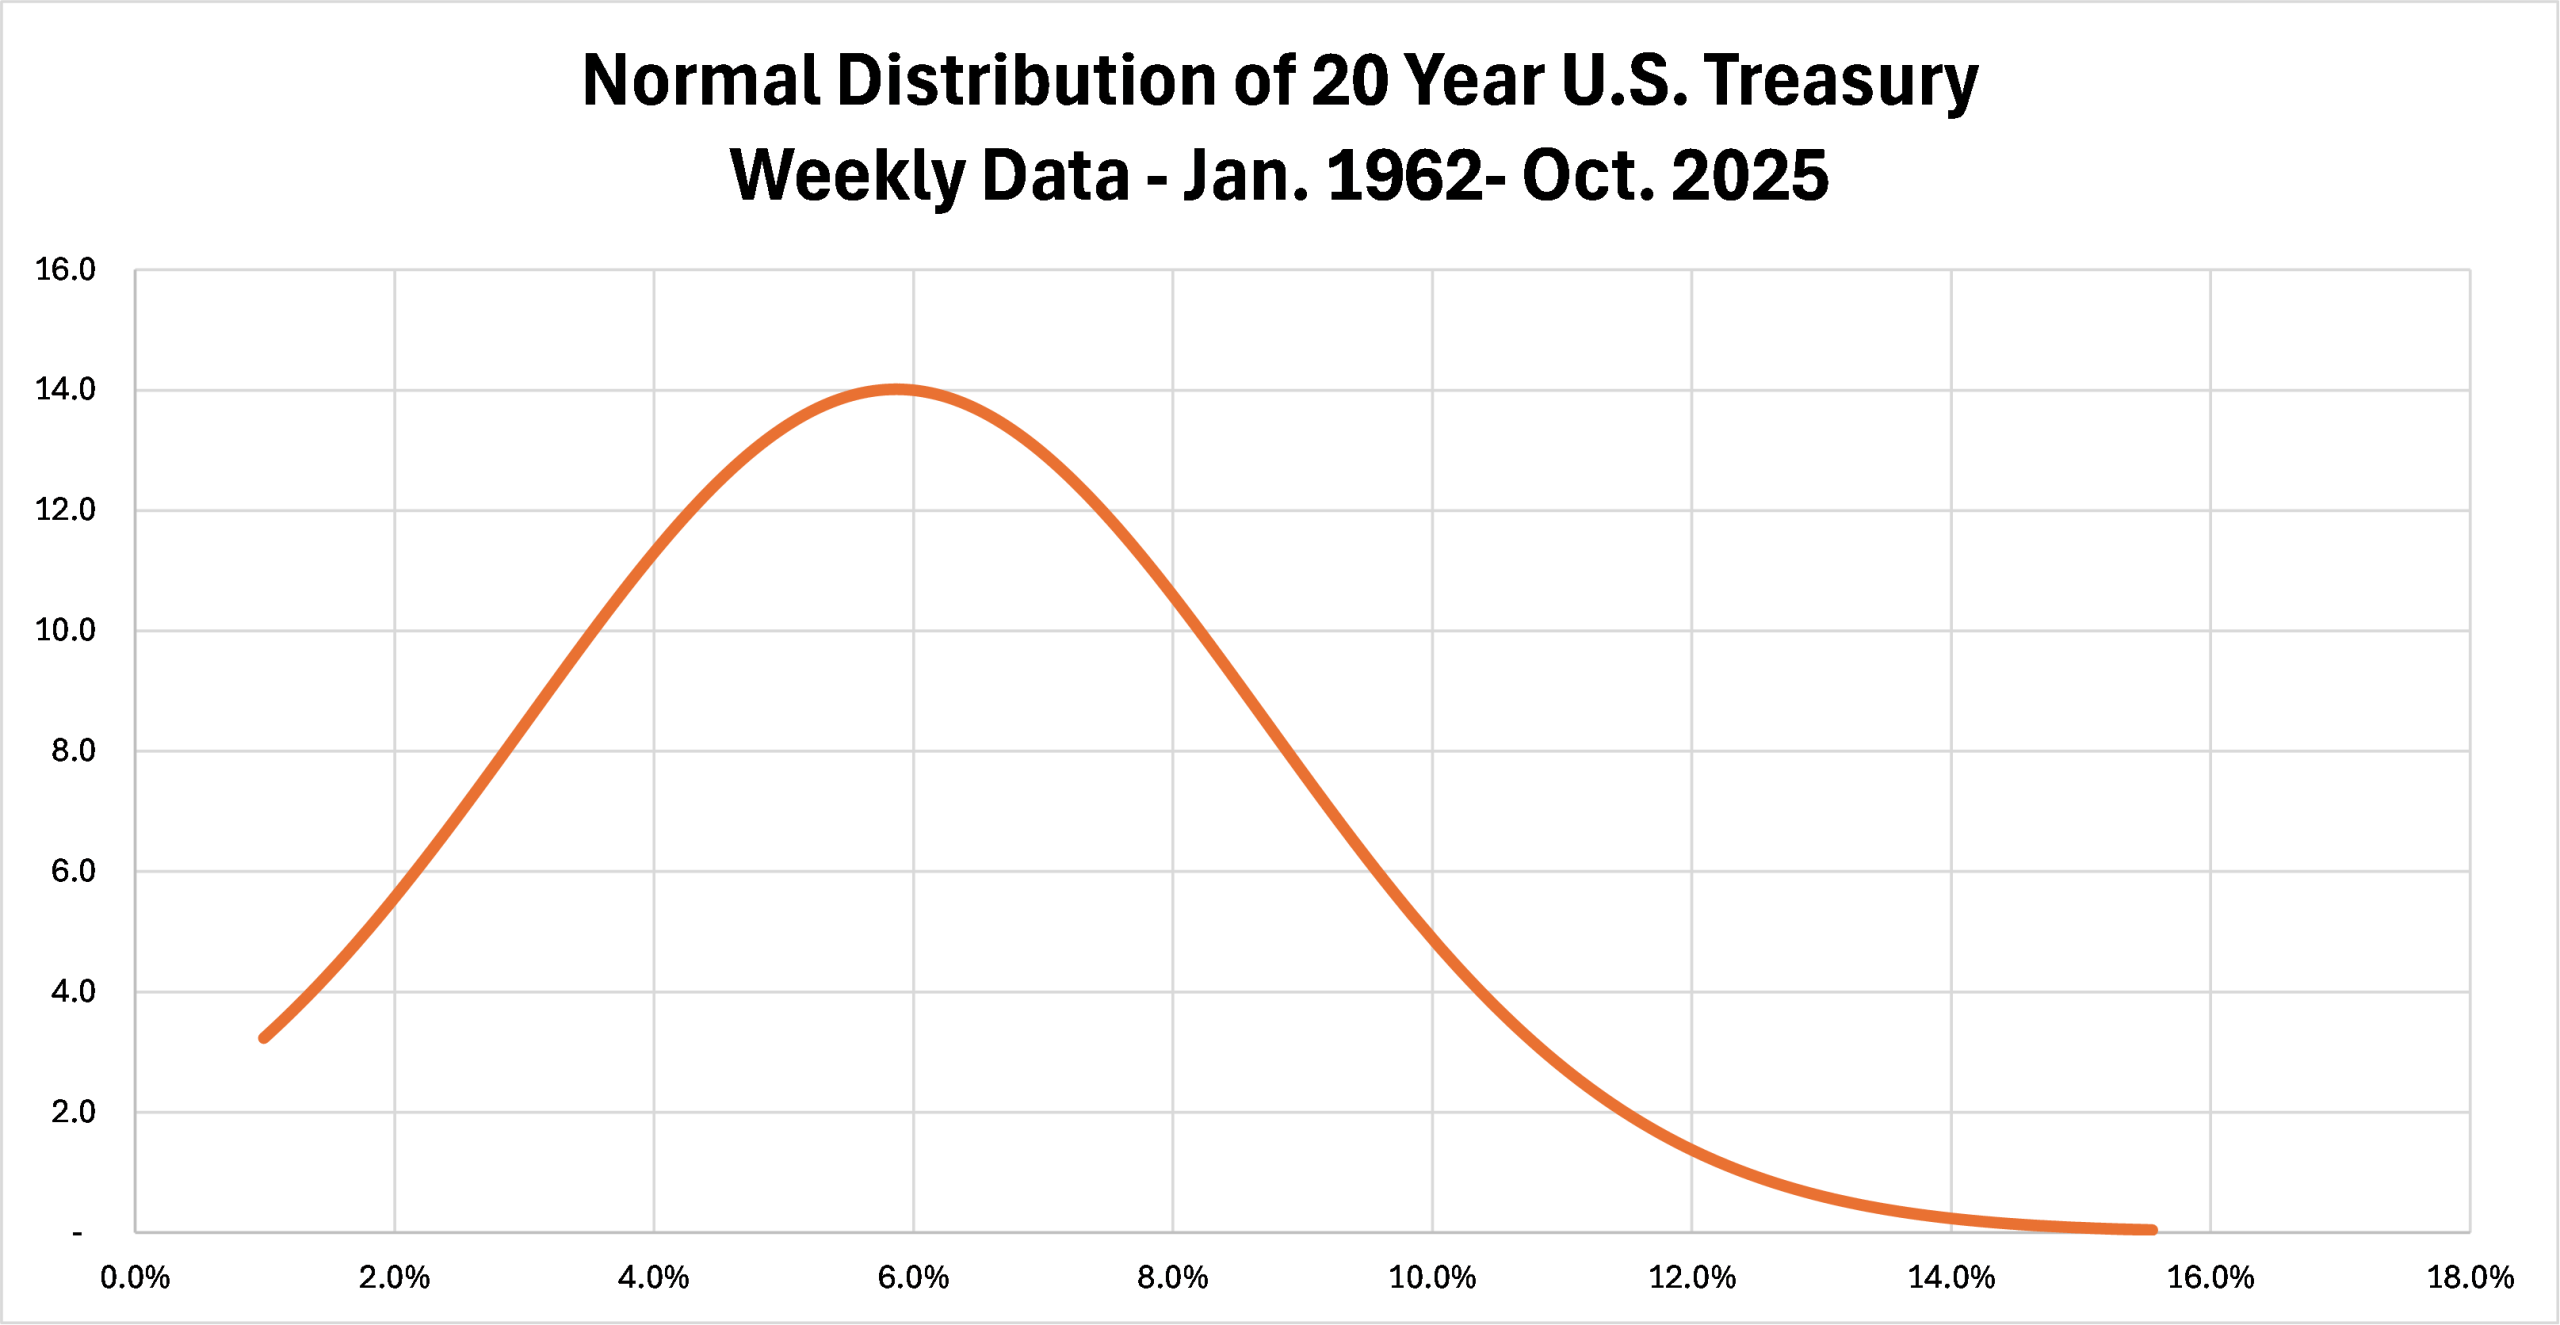
The 1962–2025 data for the 20-year U.S. Treasury resembles a right-skewed distribution. Further analysis of the data shows a positive skew, as the median (5.3%) is less than the average (5.9%). While not typically discussed in relation to related to the risk-free rate, it is useful to understand that the median can be an alternative to the average for skewed datasets, as it removes the effects of outliers.
The CRSP reports data using arithmetic (equal weighted) averages, and variations can be caused by historical averages using daily, weekly, monthly, quarterly, or annual information. Using arithmetic averages assumes each data point represents a likely future possibility. Analysts may also consider the geometric average (mean) which smooths the mean through year-over-year compounding. Note the implied assumption in averaging historical time periods is the government bond yields revert to the mean.
Larger sample size may reduce the effects of outliers but may include economic conditions that less resemble those of the measurement date. The data may also include abnormalities created by monetary and fiscal policy and/or the availability of collected information prior to 1962. For business valuations, the focus on the overall cost of capital should not be an excuse for misapplying the component parts.
Past is Not the Future
In May 2025, Moody’s downgraded credit ratings for the U.S. Government from Aaa to Aa1, to reflect the “sharp” increases in the national debt and continuous fiscal deficits.[23] This move follows other downgrades from S&P (AA+ in 2011) and Fitch Ratings (AA+ in 2023) for similar reasons.
Moody’s noted the fundamentals of the U.S. economy and its capacity to adjust its fiscal trajectory offer resilience to fiscal shocks.[24] Deficit spending is forecast to continue, with CBO estimated deficits increasing as a percentage of gross domestic product (GDP), with no credible plans to change the trajectory. The General Accountability Office (GAO) also deems the current fiscal path “unsustainable”.[25] These conditions favor weighting current and forecasted rates over older data.
The following factors are additional considerations for evaluating whether to normalize the risk-free rate.
|
Factor |
Relevance |
Future Risk Impact |
|
Merrill Lynch Option Volatility Estimate (MOVE Index) |
The MOVE Index reflects the level of volatility in U.S. Treasury futures. The index peaked during the Great Recession at 213, with current volatility indications around 69.[26] |
Mixed. The MOVE Index has been more volatile than the CBOE Volatility Index (VIX) since July of 2022, indicating uncertainty for long-term bondholders. |
|
U.S. Dollar as Reserve Currency |
The U.S. dollar’s status as the world’s dominant reserve currency provides significant credit support, though the government’s weakened capacity, limited budget flexibility, and rising debt burden have contributed to a decline in fiscal metrics.[27] |
Mixed. The U.S. dollar declined from approximately 62% of foreign exchange reserves during the Great Recession to 56% in 2025.[28] |
|
Interest Expense |
Interest as a percentage of U.S. government revenue is expected to increase from 17.9% from fiscal year 2025 to 22.2% by 2035.[29] |
Negative. Higher levels of national debt increase the funds needed to cover interest commitments, and creditor risk perception may cause the rate to increase. |
Conclusion
Experts following Rule 702 of the Federal Rules of Evidence[30] must demonstrate to the court that it is more likely than not that their testimony will:
- Help the trier of fact to understand the evidence or to determine a fact in issue;
- Be based on sufficient facts or data;
- Be the product of reliable principles and methods; and
- Reflect a reliable application of the principles and methods to the facts of the case.
The risk-free rate is a forward-looking concept and reasonable experts may differ in how that is interpreted. Therefore, to ensure credibility, the expert’s opinion on the risk-free rate for business valuations and damages engagements must be well-supported, reliable, and properly applied.
Spot rates can be objectively verified, though subject to distortions from monetary and fiscal policy. Using the spot rate simplifies the methodology and is the method preferred by Kroll in most circumstances. For business valuations, any additional risk the analyst deems appropriate can be included in the company-specific risk assessment.
Analysts relying on “normalized” rates assume that some average of historical periods is a reliable prophesy of the future; more reliable than the spot rate. Adjusting the risk-free rate requires conscientious thinking about to what degree the past represents the future, and how the data is applied to the engagement. Experts should be versed on the impact of all the factors discussed in this article. If using a normalized rate, the expert should be prepared to defend it.
[1] Pratt, Shannon and Grabowski, Roger, Cost of Capital in Valuation of Stock by the Income Approach: Updated for an Economy in Crisis, The Valuation Examiner, January/February 2009.
[2] Ibid.
[3] Pratt, Shannon and ASA Educational Foundation, Valuing a Business, Sixth Edition, McGraw Hill, 2022, Page 215.
[4] Kroll Recommended U.S. Equity Risk Premium and Corresponding Risk-Free Rates to be Used in Computing Cost of Capital: January 2008 – Present, September 2, 2025, https://www.kroll.com/en/reports/cost-of-capital/recommended-us-equity-risk-premium-and-corresponding-risk-free-rates.
[5] Koller, Tim, Goedhar, Marc, and Wessels, David, Valuation: Measuring and Managing the Value of Companies, Seventh Edition, John Wiley & Sons, Inc., 2020, Page 313.
[6] Damodaran, Aswath, What is the risk-free rate? A Search for the Basic Building Block, December 2008, https://pages.stern.nyu.edu/~adamodar/pdfiles/papers/riskfreerate.pdf.
[7] Hitchner, James, Financial Valuation: Applications and Models, Fifth Edition, John Wiley & Sons, Inc., 2025, Page 301.
[8] Pratt, Shannon and Grabowski, Roger, Cost of Capital: Applications and Examples, Third Edition, John Wiley & Sons, Inc., 2008, Page 71.
[9] Damodaran, Aswath, What is the risk-free rate? A Search for the Basic Building Block, December 2008, https://pages.stern.nyu.edu/~adamodar/pdfiles/papers/riskfreerate.pdf.
[10] U.S. Bureau of Labor Statistics, Consumer Price Index (CPI) for All Urban Consumers (CPI-U), Series Id: CUUR0000SA0, All items in U.S. city average, all urban consumers, not seasonally adjusted.
[11] Federal Reserve Bank of Philadelphia, The Livingston Survey, June 2025, Page 4. This is consistent with the Congressional Budget Office Consumer Price Index estimate of 2.2%-2.4% for the years 2024–2035. See The Budget and Economic Outlook: 2025 to 2035, January 2025.
[12] Kroll, Risk-free Rate Methodology, Cost of Capital Navigator Resources Library, Page 2. Note: Duff & Phelps acquired Kroll in 2018.
[13] See: https://edge.sitecorecloud.io/krollllc17bf0-kroll6fee-proda464-0e9b/media/Cost-of-Capital/kroll-uk-erp-rf-table-new-2022-updated.pdf.
[14] 2017 Valuation Handbook U.S. Guide to Cost of Capital, Duff & Phelps, John Wiley & Sons, Inc., Hoboken, New Jersey, Page 3-19.
[15] Since 2004, the U.S. Treasury has been publishing Long-Term Real Rate averages. This series is intended for use as a proxy for long-term real rates. See U.S. Treasury Website, Interest Rate Statistics, https://home.treasury.gov/policy-issues/financing-the-government/interest-rate-statistics, October 28, 2025. Real data excludes inflation whereas nominal includes both real data and inflation. Analysts must match the rate selected to the appropriate cash flows.
[16] AICPA, Statements on Standards for Valuation Services (SSVS), VS Section 100 ¶21. The conclusion of value may be either a single amount or a range.
[17] Federal Reserve Bank of St. Louis, Board of Governors of the Federal Reserve System, Series ID WGS20YR, https://fred.stlouisfed.org/data/WGS20YR. Note: frequency of data is weekly average of business days and quoted on an investment basis.
[18] Federal Reserve Bank of St. Louis, Board of Governors of the Federal Reserve System, Series ID WGS20YR, https://fred.stlouisfed.org/data/WGS20YR, as of October 10, 2025.
[19] Calculated using the Federal Reserve Bank of St. Louis, Board of Governors of the Federal Reserve System, Market Yield on U.S. Treasury Securities at 20-Year Constant Maturity, Quoted on an Investment Basis (DGS20).
[20] Board of Governors of the Federal Reserve, What is the purpose of the Federal Reserve System?, https://www.federalreserve.gov/faqs/about_12594.htm.
[21] Global GT LP and Global GT LTD v. Golden Telecom, Inc., Del. Court of Chancery, C.A. No. 3698-VCS, April 23, 2010. Note: The Court was referring to the estimation of long-term equity returns.
[22] The Center for Research in Security Prices data became publicly available in 1962, creating the first comprehensive market database to accurately measure stock market returns.
[23] Press Release, Moody’s Ratings, https://ratings.moodys.com/ratings-news/443154, May 16, 2025. Moody’s also downgraded many government agencies including Fannie Mae and Freddie Mac, see https://ratings.moodys.com/ratings-news/443242.
[24] Ibid.
[25] General Accountability Office, Executive Summary to the FY 2024 Financial Report of the U.S. Government, https://fiscal.treasury.gov/files/reports-statements/financial-report/2024/executive-summary-2024.pdf. See further analysis by Darrell Dorrell: GAO Audited USA Financials 10 Years Ended September 30, 2023, Financial Forensics/NACVA, February 10, 2025.
[26] See MacroMicro Website, US – Equity and Bond Volatility, https://en.macromicro.me/charts/57819/us_equity_bond_volatility, last accessed October 25, 2025.
[27] Compiled from the following press releases: Moody’s Ratings, https://ratings.moodys.com/ratings-news/443154 and https://ratings.moodys.com/ratings-news/443242.
[28] International Monetary Fund Dataset: Currency Composition of Official Foreign Exchange Reserves (COFER),https://data.imf.org/en/Data%20Explorer?datasetUrn=IMF.STA:COFER(7.0.0)&dataPresentation=H_COFER_OFES_CURRENCY, last accessed October 25, 2025.
[29] Congressional Budget Office, The Budget and Economic Outlook: 2025 to 2035, January 2025, Table B-1, Page 20.
[30] Federal Rules of Evidence, December 1, 2024, Committee on the Judiciary House of Representatives.
Jason Pierce, CPA, CMA, CFM, CVA, MAFF, has over 30 years of experience and serves as a financial expert in various accounting and finance-related disciplines. He is a Managing Director and leads Paradigm Forensics’ Anchorage and Boston offices, and works with clients on disputes, transactions, fraud, damages, family law, criminal, and estate planning engagements. He is a lead instructor for NACVA’s Master Analyst in Financial Forensics (MAFF) certification program and other courses including the Forensic Accounting Academy and the Commercial Damages and Lost Profits Workshop. He is a regular speaker at legal and professional organizations. He is an active member of the Massachusetts Society of CPAs (Business Valuation Committee) and the Boston Chapter of the Institute of Management Accountants (Vice President – Education).
Mr. Pierce can be contacted at (410) 609-4740 or by e-mail to jpierce@paradigmforensics.com.