
Using a Non-Beta-Adjusted Size Premium in the Context of the CAPM Will Likely Overstate Risk and Understate Value
Measuring the Relative Performance of Small Stock vs. Large Stock and the Cost of Equity
Roger Ibbotson and James Harrington discuss two different ways of measuring the relative performance of small stocks versus large stocks in this article: (i) the “small stock premium” and (ii) the “beta-adjusted size premium”. Ibbotson and Harrington demonstrate why using a non-beta-adjusted size premium within the context of the capital asset pricing model (CAPM) to estimate cost of equity capital will likely “double count” beta risk, and therefore overstate risk and understate value. The authors also demonstrate that a non-beta-adjusted size premium used in conjunction with “build-up” methods that employ an industry risk premium would be equally inappropriate.

Roger Ibbotson and James Harrington discuss two different ways of measuring the relative performance of small stocks versus large stocks in this article: (i) the “small stock premium” and (ii) the “beta-adjusted size premium”. Ibbotson and Harrington demonstrate why using a non-beta-adjusted size premium within the context of the capital asset pricing model (CAPM) to estimate cost of equity capital will likely “double count” beta risk, and therefore overstate risk and understate value. The authors also demonstrate that a non-beta-adjusted size premium used in conjunction with “build-up” methods that employ an industry risk premium would be equally inappropriate.[1],[2]
The “Small Stock Premium” and the “Beta-Adjusted Size Premium” Are Different Things, and are Used for Different Purposes
The “small stock premium” and a “beta-adjusted size premium” are both informative about the performance of small company stocks relative to large company stocks. However, they are different things, and are used for different purposes.
The small stock premium is the difference between the returns of small capitalization (small-cap) stocks and large capitalization (large-cap) stocks. This difference can be used in a top-down review of market performance and general discussions of whether small-cap stocks perform better than large-cap stocks over time and can also be used to develop long-term inputs for use in mean-variance optimization (MVO) analyses or wealth forecasting.[3]
Alternatively, a beta-adjusted size premium is also an indication of the relative market performance of small-cap versus large-cap stocks, but is typically used for a very specific purpose: as a “size” adjustment within the context of the capital asset pricing model (CAPM) when developing cost of equity capital estimates.[4] A size adjustment is typically applied to the CAPM to make up for the fact that the betas of smaller companies do not fully explain their observed returns. Because the CAPM already includes a beta input in its textbook specification, the size premium is then “beta adjusted” to remove the portion of realized excess return that is attributable to beta, thereby isolating the size effect’s contribution to realized excess return and avoiding double counting the impact of each factor.
Calculating the Small Stock Premium
The “small stock premium” can be defined as the simple difference between small-cap stock total returns (as measured by the Ibbotson Associates Small Company Stock total return index) and large-cap stock total returns (as measured by the Ibbotson Associates Large Company Stock total return index).[5],[6] The small-stock premium is given by:[7],[8]
Small Stock Premium = (Small Stock Total Return – Large Stock Total Return)
In Exhibit 1, the small stock premium is calculated on an annual basis from 2010 through 2017.
Exhibit 1: Annual Small Stock Premium (2010‒2017)
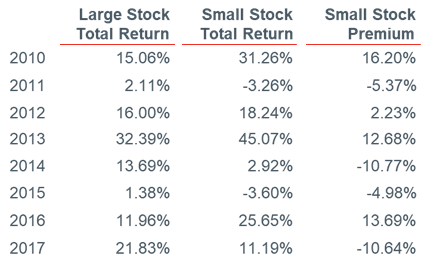
Source of underlying data in Exhibit 1: Stocks, Bonds, Bills, and Inflation® (SBBI®) return series from the Morningstar Direct database. Series used: (i) Large Company Stocks (IA SBBI® US Large Stock TR USD Ext). The “SBBI® US Large Stock” return series is essentially the S&P 500 index. (ii) Small Company Stocks (IA SBBI® US Small Stock TR USD). Used with permission. All rights reserved. Calculations performed by Duff & Phelps, LLC.
For example, in calendar year 2010, small-cap stocks had a total return of 31.26%, and large-cap stocks (as measured by the S&P 500 total return index) had a total return of 15.06%. The small stock premium for 2010 was therefore 31.26% – 15.06%, or 16.20%. Note that the small stock premium is not always positive, especially over shorter periods of time.[9]
The small stock premium can also be calculated over longer periods of time. For example, the average annual return of large-cap stocks (as measured by the S&P 500 total return index) from 1926 through 2017 was 12.06%, and the average annual return of small-cap stocks (as measured by the Ibbotson Associates Small Company Stock total return index) over the same period was 16.52%, implying a small stock premium of 4.46% (16.52% – 12.06%).[10]
Calculating a Beta-Adjusted Size Premium
In the Duff & Phelps online Cost of Capital Navigator (dpcostofcapital.com) there are two different valuation data sets, each of which includes beta-adjusted size premia that can be used as inputs when estimating the cost of equity capital: (i) the CRSP Size Premia Study, and (ii) the Risk Premium Report Study.[11] The size premia presented in both the studies are “beta-adjusted”, and are calculated using the same methodological framework.[12] For simplicity, in this article we employ data from the CRSP Deciles Size Study in the examples presented.
Size premia are calculated here as the difference in historical portfolio excess returns (i.e., what did happen), and the excess returns that CAPM would have predicted. Excess returns are defined here as returns over and above the risk-free asset’s returns. This is the same way that the size premia were calculated in the Ibbotson Associates/Morningstar SBBI Valuation Yearbook (1999‒2013), the Valuation Handbook—U.S. Guide to Cost of Capital (2014‒2017), and now in the online Cost of Capital Navigator (2018 and subsequent years).
First, let’s examine the base (i.e., “textbook”) CAPM equation to see what is meant by “excess returns that CAPM would have predicted”. The base CAPM equation can be expressed as follows:[13]
Cost of equity = Risk-free Rate + (Beta x Equity Risk Premium)
Or notationally as:
Ke = Rf + (ß x RPm)
“Excess returns” are defined here as returns over and above the risk-free asset’s returns. Anything added to the risk-free rate (“Rf” in the equation above) is by definition “over and above” the risk-free rate. In the base CAPM equation, “excess returns” is therefore represented by beta multiplied by the equity risk premium (in the equation this is “ß x RPm”):

A problem with the base CAPM equation is that it is not very reliable in predicting the realized excess returns of small-cap companies. To demonstrate this, we can use the CAPM equation to decompose the average annual return of CRSP decile 10 (comprised of the smallest companies, as measured by market capitalization).[14]
In Exhibit 2, the average annual returns of CRSP NYSE/NYSE MKT/NASDAQ deciles 1–10 over the period 1926–2017 period for are shown. As size (in this case, as measured by market cap) decreases, the realized return tends to increase. For example, the average annual return of decile 1 (the largest-cap companies) was 11.19% over the 1926–2017 period, while the annual arithmetic mean returns of decile 10 (the smallest-cap companies) was 20.19%.
Note that this increased return comes at a price: risk (as measured by standard deviation) increases from 18.86% for decile 1 to 42.22% for decile 10. The increase in standard deviation of returns is correlated with the increase in the decile betas. The relationship between risk and return is a fundamental principle of finance and the framework to estimate cost of capital.
Exhibit 2: Summary Statistics of Annual Returns (CRSP NYSE/NYSE MKT/NASDAQ Deciles)
1926–2017

Source of underlying data: CRSP U.S. Stock Database and CRSP U.S. Indices Database © 2018 Center for Research in Security Prices (CRSP®), University of Chicago Booth School of Business. CRSP NYSE/NYSE MKT/NASDAQ deciles 1–10. Used with permission. All rights reserved. Calculations performed by Duff & Phelps, LLC. To learn more about CRSP, visit crsp.com.
The predicted excess returns of CRSP decile 10 using the base CAPM equation can be calculated in the following fashion. Again, the base CAPM equation is:
Cost of equity = Risk-free Rate + (Beta x Equity Risk Premium), or
Ke = Rf + (ß x RPm)
To calculate the excess return of CRSP decile 10 using the base CAPM equation, we need a beta (ß) and an equity risk premium (RPm):
- The beta (ß) of CRSP Decile 10 is 1.39
- The “historical” average annual long-term equity risk premium (RPm) is 7.07%, calculated as the difference between the average annual total return of the S&P 500 total index (12.06%) and the average annual income return (4.99%) of a long-term (i.e., 20-year) U.S. Treasury bond (the “risk-free” asset).
The “excess return” (“ß x RPm” in the textbook CAPM equation) of CRSP decile 10 is therefore 9.84%:
Excess Return of CRSP Decile 10 = ß x RPm = 1.39 x 7.07% = 9.84% (difference due to rounding)[15]
To gauge how well the base CAPM equation did at predicting the excess returns of CRSP decile 10, we can compare the textbook CAPM equation estimate of what “should have happened” with what “actually happened”.
Looking to Exhibit 2, the actual average annual return of CRSP decile 10 over the 1926‒2017 period was 20.19%, and the average annual income return of a long-term (i.e., 20-year) U.S. Treasury bond (the “risk-free” asset) was 4.99%.
- The actual excess return of CRSP decile 10 is therefore 15.20% (20.19% –99%).
- The textbook CAPM equation estimate of excess returns for CRSP Decile 10 was 9.84%.
The textbook CAPM equation did not do a very good job of predicting the excess returns of CRSP decile 10, which is comprised of the smallest companies. The textbook CAPM equation estimate of what “should have happened” fell 5.37% (15.20% ‒ 9.84%) short of what “actually happened”.[16]
This analysis demonstrates why valuation professionals typically add a “size premium” to the base CAPM equation: the betas of small-cap companies do not fully account for the actual excess returns that are typically seen with small-cap companies. The 5.37% that the textbook CAPM equation fell short is assumed to be a function of “size”, and is therefore added as a “beta-adjusted” size premium in the “modified” CAPM equation (MCAPM), which includes an adjustment for size:
Cost of equity = Risk-free Rate + (Beta x Equity Risk Premium) + Size Premium, or

The average annual return of CRSP Decile 10 is thus decomposed into three components using the modified CAPM: (i) the risk-free rate (4.99%), (ii) the excess returns predicted by the systematic risks measured by beta and the equity risk premium (9.84%), and (iii) the return in excess of what the textbook CAPM predicted (5.37%), also known as a beta-adjusted size premium. This decomposition is illustrated in Exhibit 3.
Exhibit 3: Decomposition of CRSP Decile 10 Average Annual Returns Using the Modified CAPM Equation
1926–2017

What Does “Beta-Adjusted” Mean?
A “beta-adjusted” size premium has been adjusted to remove the portion of excess return that is attributable to beta (within the context of the CAPM), therefore isolating the size effect’s contribution to excess return. But what exactly does this mean? When we say we are “adjusting” (i.e., “controlling”) for something, what we mean is that we want to exclude the influence of something from a calculation.
In Exhibit 4, the predicted excess return for CRSP decile 10 (9.84%) is calculated in the textbook CAPM equation by the beta multiplied by the equity risk premium (β x ERP). It follows that anything over and above what the base CAPM predicts (in this case, 5.37%) is (by definition) not the result of the risks embodied by the beta and equity risk premium. We can thus say that the 5.37% portion of excess returns is “beta-adjusted” within the framework of the CAPM equation.
Exhibit 4: CAPM Decomposition of the Annual Average Return of CRSP Decile 10 (20.19%) Over the Time Period 1926‒2017

Why the Portion of Excess Returns Over and Above What CAPM Predicts is Attributed to “Size”
Exhibit 2 displays the betas, arithmetic average (i.e., “mean”) annual return, and standard deviation of CRSP deciles 1–10, measured over 1926–2017. We noted in the discussion of Exhibit 2 that as size (in this case, as measured by market cap) decreases, return tends to increase.
Exhibit 5 depicts a “scatterplot” graph of the betas (horizontal axis) and average annual returns (vertical axis) from Exhibit 2 of each of the CRSP deciles 1–10. In the graph, the ten red dots represent CRSP deciles 1 (comprised of the largest companies) through CRSP decile 10 (comprised of the smallest companies), and the dark gray triangle is the “market” benchmark (the S&P 500 Index; beta = 1.00).
The security market line (SML) in Exhibit 5 represents what the textbook CAPM equation (without an adjustment for size) predicts as the excess return for each of the CRSP deciles, dependent on the respective levels of systematic risk (beta) for each. Note that the textbook CAPM equation does not do a very good job of predicting the realized excess return of the deciles, which fall increasingly above the security market line as size decreases. This indicates that these deciles have returns in excess of what their systematic risk implies. Another way of saying this is that within the context of the CAPM, the betas of small-cap companies do not fully account for (or explain) their actual returns. Because the amount of this difference (what actually happened versus what CAPM predicted) varies with “size” (in this case, as measured by market capitalization) we call it a “size premium”. It is not clear, however, whether this is due to size itself, or to other factors closely related to or correlated with size. [17]
We previously used the CAPM equation to decompose the average annual return of CRSP decile 10 from 1926 through 2017 (20.19%) into (i) the return on a risk-free asset (4.99%), (ii) the excess returns predicted by the textbook CAPM (9.84%), and (iii) excess return over and above what CAPM predicted (5.37%), which represents the “beta-adjusted size premium” for Decile 10 as of December 31, 2017. For a different perspective (and aid in understanding this concept), these values (4.99%, 9.84%, 5.37%) have been included in Exhibit 5.
Exhibit 5: Security Market Line versus CRSP Deciles 1–10; 1926–2017

The Potential Danger of Using a Non-Beta-Adjusted Size Premium in the Context of the CAPM to Estimate Cost of Equity Capital
To answer this question, revisit the earlier discussion about the calculation of the “small stock premium”. The small stock premium is related to the beta-adjusted size premium, insofar as each contains information about the relative performance of small-cap versus large-cap stocks. However, they are not interchangeable as far as usage.
As previously discussed, for forward-looking long-term forecasting purposes, the small stock premium is typically calculated as the simple difference in the average annual returns of small stocks and large stocks.
Earlier in this article we calculated a small stock premium in this fashion using the Ibbotson Associates “Large Company Stocks” series (which is essentially the S&P 500 index) and “Small Company Stocks” series that have traditionally been used in the Ibbotson Associates/Morningstar SBBI Yearbook for such calculations.[18] In the following section, an equivalent calculation of a long-term “small stock premium” for forecasting purposes can be accomplished using the S&P 500 index as the market benchmark, but this time with CRSP decile 10 as the proxy for “small stocks”. [19],[20]
Calculating a Small Stock Premium (i.e., a Non-Beta-Adjusted Size Premium) Using CRSP
Decile 10
A small stock premium for CRSP decile 10 can be calculated as the simple difference between the average annual return of the market benchmark (in this case, the S&P 500 index) from 1926–2017, and the average annual return of CRSP Decile 10 over the same time period. The average annual return of large stocks (as measured by the S&P 500 total return index) from 1926 through 2017 was 12.06%, and the average annual return of small stocks (as measured by CRSP decile 10) over the same period was 20.19%, implying a “small stock premium” of 8.13% (20.19% – 12.06%).
The result of this calculation is effectively a “non-beta-adjusted” size premium.
Potential of Double Counting Risk
Compare this non-beta-adjusted size premium result (8.13%) to the beta-adjusted size premium result (5.37%) previously developed for CRSP decile 10. The non-beta-adjusted size premia for CRSP decile 10 is larger than the beta-adjusted size premia by 2.76% (8.13% – 5.37%). This is likely because some risks being measured in the small stock premium overlap with systematic risks already being measured within the context of the CAPM in the term where beta is multiplied by the equity risk premium (β x ERP). This “double counting” of risk is illustrated in Exhibit 6.
Exhibit 6: CAPM Decomposition of the Annual Average Return of CRSP Decile 10 (1926‒2017)

As illustrated in Exhibit 6, using the small stock premium (i.e., a non-beta-adjusted size premium) in the context of the CAPM to estimate cost of equity capital will likely overstate risk, and thus understate value.
In pre-1995 versions of the Ibbotson Associates Stocks, Bonds, Bills, and Inflation® (SBBI®) “Classic” Yearbook, the book actually did suggest that the “small stock premium” could be added to the CAPM as a size adjustment to the CAPM. That changed in the 1995 version of that book, when Ibbotson Associates began “beta-adjusting” the size premia they published, stating, “The size premia given here (…) are adjusted for beta. That is, small stocks do have higher betas than large stocks; the return, above what might be expected because of the higher betas, is the size premia. These size premia increase as the capitalization of the company decreases.”[21]
In 1999, Ibbotson Associates used the single chapter dedicated to valuation issues in the SBBI® “Classic” Yearbook and used it as the basis for a new “yearbook” dedicated solely to valuation issues, the Stocks, Bonds, Bills, and Inflation® (SBBI®) “Valuation” Yearbook. That book provided significantly expanded commentary and analysis of valuation issues, plus “Key Variables in Estimating the Cost of Capital”, which included size premia and other valuation inputs.
Can a Non-Beta-Adjusted Size Premium Be used With the Build-Up Method?
Thus far the discussion has been focused on the use of beta-adjusted size premia within the context of the modified CAPM (MCAPM), and the potential for double-counting risk if the “small stock premium” (i.e., a non-beta-adjusted size premium) is used.
A non-beta-adjusted size premium should not be used in “build-up” methods of estimating cost of capital that employ an industry risk premium and a size premium together in the same equation. The reason is that the MCAPM equation and the equation of a build-up method that employs an industry risk premium and a size premium are exactly equivalent. In other words, this formulation of the build-up method is merely the MCAPM with the terms re-arranged.
To understand why, it is important to appreciate that an industry risk premium is simply a beta that has been modified so that it can be added as a simple “up or down” adjustment in a build-up method of estimating cost of equity capital (i.e., an additive risk adjustment in the equation). Industry risk premia are calculated as follows:
Industry Risk Premium = RPi = (Beta x Equity Risk Premium) – Equity Risk Premium, or
RPi = (ß x RPm) – RPm
One of the variations of the build-up method can be expressed as the following equation:
Ke = Rf + RPm + RPi + RPs
To demonstrating algebraically that the MCAPM and this formulation of the build-up method are equivalent, we can substitute the Industry Risk Premium equation (above) into the build-up equation for the term “RPi”, and we obtain the following:
Ke = Rf + RPm + (ß x RPm – RPm) + RPs
We can then simplify the equation further, as the positive and negative RPm factors cancel out:
Ke = Rf + RPm + (ß * RPm – RPm) + RPs
Which simplifies to the MCAPM equation:
Ke = Rf + ß * RPm + RPs
Because a build-up equation that employs an industry risk premium and a size premium is the exact equivalent of the MCAPM equation, a beta-adjusted size premium must also be used in conjunction with this formulation of the build-up method. If a non-beta-adjusted size premium is used, it will likely embody risks that overlap with systematic risks already being measured within the context of the build-up (just as in the MCAPM), and thus “double-count” these risks.
Conclusion
The small stock premium is related to the beta-adjusted size premium, insofar as each contains information about the relative performance of small-cap versus large-cap stocks. However, they are not interchangeable as far as usage. Using a non-beta-adjusted size premium in the context of the MCAPM (or a build-up method that includes an industry risk premium) to estimate cost of equity capital will likely overstate risk and understate value. As elegantly summarized in the inaugural Ibbotson Associates Stocks, Bonds, Bills, and Inflation® (SBBI®) “Valuation” Yearbook in 1999:
“The non-beta-adjusted size premia already account for the added return generally attributed to the higher betas of small companies. Again, the non-beta-adjusted size premium makes the assumption that the beta of the company is the same as the small stock portfolio. If the non-beta-adjusted size premium is used in the context of the modified CAPM equation…the effect of beta on return will essentially be counted double. Multiplying the equity risk premium by another measure of beta (either the company beta or industry beta) introduces to the same equation a duplicate, though possibly different, measure of systematic risk.”
‒ Roger Ibbotson, 1999 Stocks, Bonds, Bills, and Inflation® (SBBI®) Valuation Yearbook (Ibbotson Associates, Chicago), page 23.
[1] Roger Ibbotson is Chairman and Chief Investment Officer of Zebra Capital Management (www.zebracapm.com), Professor in the Practice Emeritus of Finance at Yale School of Management, and former Chairman of Ibbotson Associates and Ibbotson Associates Advisors, LLC until both were acquired by Morningstar Inc. in March 2006. He has written numerous books and articles including Stocks, Bonds, Bills, and Inflation with Rex Sinquefield (updated annually) which serves as a standard reference for information on capital market returns. He has published The Equity Risk Premium with William Goetzmann and Lifetime Financial Advice with Milevsky, Chen, and Zhu. He has also co-authored two books with Gary Brinson, Global Investing and Investment Markets. In addition, he has co-authored a textbook with Jack Clark Francis, Investments: A Global Approach. He is the recipient of many awards including Graham and Dodd Scrolls in 1979, 1982, 1984, 2001, 2004, 2007, 2011, 2012, and best Financial Analysts Journal article of 2013. He received the Harry M. Markowitz Award for “Momentum, Acceleration, and Reversal”, the 2015 best paper in the Journal of Investment Management. Most recently (2019), Ibbotson and colleagues Thomas M. Idzorek, CFA, Paul D. Kaplan, CFA, and James X. Xiong, CFA published a new Chartered Financial Analyst® (CFA) Institute Research Foundation monograph entitled “Popularity: A Bridge Between Classical and Behavioral Finance” (available for download at https://www.cfainstitute.org/en/research/foundation/2018/popularity-bridge-between-classical-and-behavioral-finance). Professor Ibbotson served on numerous boards, and currently serves as a disinterested director, Chairman of the Audit Committee and member of the Nominating Committee of Dimensional Investment Group Inc. (DIG) and DFA Investment Dimensions Group Inc. (DFAIDG), registered investment companies for which Dimensional Fund Advisors Inc. serves as investment adviser. He frequently speaks at universities, conferences, and other forums. He received his bachelor degree in mathematics from Purdue University, his MBA from Indiana University, and his PhD from the University of Chicago where he taught for more than ten years and served as Executive Director of the Center for Research in Security Prices.
[2] James P. Harrington is a Director at Duff & Phelps. James is a leading contributor to Duff & Phelps’ efforts in the development of studies, surveys, online content and tools, firm-wide valuation models, data distribution platforms, and published thought leadership. James is a co-author of the Duff & Phelps “Valuation Handbook” series and a developer of the online “Cost of Capital Navigator” platform (dpcostofcapital.com), along with colleagues Roger Grabowski and Carla Nunes.
[3] For a detailed discussion, see the 2018 Stocks, Bonds, Bills, and Inflation® (SBBI®) Yearbook, Chapter 10, “Using Historical Data in Wealth Forecasting and Portfolio Optimization”. To learn more about or purchase the SBBI® Yearbook, visit: duffandphelps.onfastspring.com/books.
[4] The base (i.e., “textbook”) CAPM equation is Cost of Equity = (Risk-free Rate) + (Beta) x (Equity Risk Premium), or notationally expressed as Ke = Rf + ß x RPm. When a size adjustment is added, this becomes Cost of Equity = (Risk-free Rate) + (Beta) x (Equity Risk Premium) + (Size Premium), or notationally expressed as Ke = Rf + ß x RPm + RPs. This modified CAPM equation is often referred to as “modified CAPM” or MCAPM.
[5] Morningstar previously published two “Ibbotson SBBI®” yearbooks: (i) The SBBI® “Classic” Yearbook, which is now produced by Duff & Phelps as the “SBBI® Yearbook” starting in 2016 (the word “Classic” was dropped from the title), and (ii) the SBBI® “Valuation” Yearbook, which was discontinued by Morningstar in 2013. The former Ibbotson Associates/Morningstar SBBI® Valuation Yearbook was replaced by the Duff & Phelps Valuation Handbook—U.S. Guide to Cost of Capital in 2014, which was published annually as a hardcover book through 2017. Starting in 2018, Duff & Phelps does not publish a physical version of the Valuation Handbook—U.S. Guide to Cost of Capital; the essential valuation data from the data exhibits are available only in the Cost of Capital Navigator online platform at dpcostofcapital.com. The major difference between the SBBI Yearbook (the former “Classic” yearbook) and other Duff & Phelps data resources (e.g., the online Cost of Capital Navigator) is that Duff & Phelps’ other data resources provide U.S. and international equity risk premia, risk-free rates, size premia, industry risk premia, betas, industry multiples and other statistics, etc., for use in valuation models, while the SBBI® Yearbook is (i) a history of the asset class returns of U.S. capital markets (thus the name, “Stocks, Bonds, Bills, and Inflation®,” or “SBBI®”) from 1926 to the present, and (ii) an analysis of the relative performance of U.S. asset classes. The SBBI® Yearbook does not provide extensive valuation data or methodology. To learn more about or purchase the Stocks, Bonds, Bills, and Inflation® (SBBI®) Yearbook, visit: duffandphelps.onfastspring.com/books.
[6] In the 2018 SBBI® Yearbook, the Ibbotson Associates SBBI U.S. Small Stock total return series (i.e., “IA SBBI US Small Stock TR USD”) is represented by: (i) the DFA U.S. Micro Cap Portfolio from April 2001 through December 2017, (ii) the DFA U.S. 9–10 Small Company Portfolio from January 1982 through March 2001, and (iii) the NYSE Fifth Quintile Returns from 1926 through 1981. The Ibbotson Associates SBBI U.S. Large Stock total return series (i.e., “IA SBBI US Large Stock TR USD Ext”) is based upon the S&P Composite Index. This index is a readily available, carefully constructed, market-capitalization-weighted benchmark of large-cap stock performance. Market-capitalization-weighted means that the weight of each stock in the index, for a given month, is proportionate to its market capitalization (price times the number of shares outstanding) at the beginning of that month. Currently, the S&P Composite includes 500 of the largest stocks (in terms of stock market value) in the U.S.; prior to March 1957 it consisted of 90 of the largest stocks. From February 1970 to the present, the large-cap stock total return is provided by S&P Dow Jones Indices, which calculates the total return based on the daily reinvestment of dividends on the ex-dividend date. S&P uses closing pricing from stock exchanges in its calculation. Prior to February 1970, the total return for a given month was calculated by summing the capital appreciation return and the income return The capital appreciation component of the large-cap stock total return is the change in the S&P 500 index as reported by S&P Dow Jones Indices from March 1928 to December 2017, and in Standard & Poor’s Trade and Securities Statistics from January 1926 to February 1928. From February 1970 to December 2017, the income return was calculated as the difference between the total return and the capital appreciation return. From January 1926 to January 1970, quarterly dividends were extracted from rolling yearly dividends reported quarterly in S&P’s Trade and Securities Statistics, then allocated to months within each quarter using proportions taken from the 1974 actual distribution of monthly dividends within quarters.
[7] “Small Stock” in this context refers to a specific data series created by Ibbotson Associates to represent smaller market capitalization (i.e., small-cap) stocks. “Small-cap” stocks can be represented in a variety of ways, including the aforementioned Ibbotson Associates “small stock” series, or the CRSP 10th decile (as is done later in this article).
[8] The small stock premium is calculated arithmetically here. Arithmetic calculation of premia is typically done when developing forward-looking long-term inputs for MVO analyses, wealth forecasting, or discount rates. The small stock premium can also be calculated on a geometric basis as (1+Small Stock Total Return) ÷ (1+Large Stock Total Return) –1. See: 2018 Stocks, Bonds, Bills, and Inflation® (SBBI®) Yearbook, Chapter 4, “Description of the Derived Series”, page 4-2. To learn more about or purchase the Stocks, Bonds, Bills, and Inflation® (SBBI®) Yearbook, visit: duffandphelps.onfastspring.com/books.
[9] Small-cap companies do not always outperform large-cap companies. However, as the holding period is increased, small-cap companies tend to outperform large-cap companies to an increasingly greater degree. In other words, the longer small-cap companies are given to “race” against large-cap companies, the greater the chance that small-cap companies outpace their larger counterparts. For a detailed discussion of this concept, see the Cost of Capital Navigator “Resources” section, 2018 Valuation Handbook—U.S. Guide to Cost of Capital, Chapter 4, “Basic Building Blocks of the Cost of Equity Capital – Size Premium”. Duff & Phelps © 2018. Available at dpcostofcapital.com.
[10] The result of this calculation can vary dependent on the series selected to represent large-cap and small-cap stocks. For example, later in this article a small stock premium is calculated over the same time horizon (1926–2017) using the same measure of large-cap stocks (the S&P 500 total return index), but a different measure of small-cap stocks (the CRSP 10th decile). The result of that calculation yields a result of 8.13% (see section entitled “Calculating a Small Stock Premium (i.e., a Non-Beta-Adjusted Size Premium) Using CRSP Decile 10”.
[11] “Premia” is the plural of “premium”.
[12] For a detailed discussion of the CRSP Size Premia Study, and the Risk Premium Report Study, see the Cost of Capital Navigator “Resources” section, 2018 Valuation Handbook—U.S. Guide to Cost of Capital, Chapter 7, “The CRSP Decile Studies and the Risk Premium Report Studies—A Comparison”. Duff & Phelps © 2018. Available at dpcostofcapital.com.
[13] Finance professionals use the term equity risk premium interchangeably with market risk premium (MRP, or RPm) and equity market risk premium (EMRP).
[14] The Center for Research in Securities Prices (CRSP) constructs 10 market-capitalization-weighted deciles that are then sorted by market cap. CRSP decile 1 is comprised of the largest companies, and CRSP decile 10 is comprised of the smallest companies. The CRSP deciles are comprised of publicly traded U.S. companies from the NYSE, the NYSE MKT, and the NASDAQ exchanges. To learn more about CRSP, visit www.CRSP.com. The CRSP standard market-capitalization-weighted deciles were used to calculate size premia in Ibbotson Associates/Morningstar SBBI® Valuation Yearbook (1999‒2013), the Duff & Phelps Valuation Handbook—U.S. Guide to Cost of Capital (2014‒2017), and now in the online Cost of Capital Navigator (2018 and subsequent years) at dpcostofcapital.com.
[15] Difference due to rounding. Using two decimals of precision (as shown here), the result is 9.83% (1.39 x 7.07%). However, using full precision (i.e., all decimals), this result is 9.84%. We note this because “9.84%” is the actual value used as of December 31, 2017 in these calculations as published in the Cost of Capital Navigator at dpcostofcapital.com.
[16] Difference due to rounding. Using two decimals of precision (as shown here), the difference is 5.36% (15.20% – 9.84%). However, using full precision (i.e., all decimals), the difference is 5.37%. We note this because “5.37%” is the actual size premia calculated for CRSP Decile 10 as of December 31, 2017, as published in the Cost of Capital Navigator at dpcostofcapital.com.
[17] See: Roger J. Grabowski (2018) The Size Effect Continues to Be Relevant When Estimating the Cost of Capital. Business Valuation Review: Fall 2018, Vol. 37, No. 3, pp. 93-109. See also: Roger G. Ibbotson and Daniel Y.-J. Kim, “Risk and Return within the Stock Market: What Works Best?” working paper, January 8, 2016. Available at www.zebracapital.com.
[18] The SBBI® Yearbook has been published for over 30 years. The SBBI® Yearbook does not provide extensive valuation data or methodology. The SBBI® “Classic” Yearbook was published by Morningstar, Inc. from 2007 through 2015, and by Ibbotson Associates in years prior to 2007. Starting with the 2016 edition, the Stocks, Bonds, Bills, and Inflation® (SBBI®) Yearbook has been produced by Duff & Phelps (the word “Classic” was dropped from the book’s title). To learn more about or purchase the Stocks, Bonds, Bills, and Inflation® (SBBI®) Yearbook, visit: duffandphelps.onfastspring.com/books.
[19] Our previous discussion of the small stock premium was in the context of the traditional way this statistic has been calculated in the Stocks, Bonds, Bills, and Inflation (SBBI) “Classic” Yearbook, and so the Ibbotson Associates Small Company Stock total return index was used as the proxy for small-cap stocks for that calculation, as is done in that book. In this section, however, we are discussing the small stock premium and beta-adjusted size premia in the context of the CRSP deciles, and so a different proxy for small stocks is necessarily being used (CRSP decile 10).
[20] An equivalent calculation can be accomplished using any of the ten CRSP deciles; for the examples in this section we will develop a small stock premium for CRSP decile 10 to facilitate easy comparison to our earlier development of a beta-adjusted size premium for CRSP decile 10.
[21] Roger, G. Ibbotson, 1995 Stocks, Bonds, Bills, and Inflation® (SBBI®) Yearbook (Ibbotson Associates, 1995), Chapter 8, “Estimating the Cost of Capital or Discount Rate”, page 155.
Roger G. Ibbotson is Professor in the Practice Emeritus of Finance at Yale School of Management. He is also chairman and CIO of Zebra Capital Management, LLC, an equity investment and hedge fund manager. He is founder, advisor and former chairman of Ibbotson Associates, now a Morningstar Company. He has written numerous books and articles including Stocks Bonds Bills and Inflation with Rex Sinquefield (updated annually) which serves as a standard reference for information and capital market returns.
Professor Ibbotson conducts research on a broad range of financial topics, including popularity, liquidity, investment returns, mutual funds, international markets, portfolio management, and valuation. He has recently published The Equity Risk Premium and Lifetime Financial Advice. He has also co-authored two books with Gary Brinson, Global Investing and Investment Markets. He is a regular contributor and editorial board member to both trade and academic journals.
Professor Ibbotson serves on numerous boards including Dimensional Fund Advisors’ funds. He frequently speaks at universities, conferences, and other forums. He received his bachelor’s degree in mathematics from Purdue University, his MBA from Indiana University, and his PhD from the University of Chicago where he taught for more than ten years and served as executive director of the Center for Research in Security Prices.
Professor Ibbotson can be contacted at roger.ibbotson@yale.edu.
James P. Harrington is a Director at Duff & Phelps. He is a leading contributor to Duff & Phelps’ efforts in the development of studies, surveys, online content and tools, firm-wide valuation models, data distribution platforms, and published thought leadership. Mr. Harrington is a co-author of the Duff & Phelps “Valuation Handbook” series and a developer of the online “Cost of Capital Navigator” platform (dpcostofcapital.com), along with colleagues Roger Grabowski and Carla Nunes.
Mr. Harrington can be contacted at (312) 697-4938 or by e-mail to James.Harrington@duffandphelps.com.
Related posts
-

Understanding IPCPL Theory, Evidence, and Application
-

Understanding IPCPL Theory, Evidence, and Application
-

When We Play Safe, We Play Small
-

Revenue Drivers and KPIs in the Realm of Business Valuation
-

New Detailed Cost of Capital Case Study: Step-by-Step Comparison of the Kroll Cost of Capital Navigator, BVR Cost of Capital Pro, Damodaran Data, and Surveys
-

Why Do We Mess With the Cost of Equity
-

Risk and Fraud
-

How Fees Help Determine Client Perceptions of Value
