
Estimating Nonprofit Corporation
Asset Values (Part III of III)
This is the third of a three-part article that focuses on valuing nonprofit corporation assets. Valuation analysts are commonly engaged to provide fair market value guidance related to nonprofit business transactions. Nonprofit businesses are often involved in arms-length transactions. Common transactions include royalty payments for the use of intellectual property, royalty revenue earned by licensing intellectual property, sales of assets, and purchases of assets. If the subject transaction is between a nonprofit and a related party, the transaction is required to be a fair market value transaction. This series provides an example of certain steps and procedures that can be used to value the assets of a nonprofit business.

[su_pullquote align=”right”]Resources:
Estimating Nonprofit Corporation Asset Values (Part I of III)
Estimating Nonprofit Corporation Asset Values (Part II of III)
[/su_pullquote]
Functional Obsolescence Analysis
In order to estimate the obsolescence adjustment for the scientific educational content, statistical information was provided from Net Nonprofit Corporation (the Company or NNC) management reflecting the aging or seasoning and the usage of scientific content. NNC management provided website page views by the year in which the content was created. The total NNC website page views were 2.1 million and covered the content created from 2012 through 2017. It was observed that there were greater website page views for content created in 2017, or 650,000 page views, in contrast to website page views for content created in 2015, or 500,000 page views. This indicates that the 2015 content is subject to some level of functional obsolescence because it does not yield the same utility, as measured by website page views, as the 2017 content.
Two methods were used to estimate functional obsolescence. The first method is based on total website page views for content created in each year from 2012 to 2017. Since 2017 yielded the greatest website page views, comparisons of each of the other year’s website page views as a percentage 2017’s website page views were performed. For example, based on the total website page views for content created in 2017, the 2015 content represented 77 percent (500,000 / 650,000). Applying this percentage to the total number of page views for 2015 resulted in an adjusted total website page view for 2015 content of 384,615 (500,000 times 77 percent). In other words, based on this method, 77 percent of the content created in 2015 is not considered functionally obsolete and 23 percent of the content is considered functionally obsolete. Applying this same process to all the remaining years results in an adjusted total website page views of 1.7 million, or 20 percent of the total 2.1 million total website page views that were not considered functionally obsolete. Consequently, 20 percent of the scientific educational content was considered obsolete.
The second method of estimating functional obsolescence includes consideration not only for the website page views for each year in which content was created, but also for the actual number of content created in each year. For example, the total number of page views for 2017 of 650,000 was divided by the total number of content titles created in 2017 of 200 to arrive at 3,250 website page views per content title. In looking at 2015 again, making the same calculation results in 1,667 website page views per content title (500,000 total website page views divided by 300 total number of content titles created). The 1,667 website page views per content title in 2013 is 51 percent of the 3,250 website page views per content title in 2017. Therefore, based on this method, 51 percent of the content titles in 2017 is not considered functionally obsolete and 49 percent is considered functionally obsolete. Applying this same process to all analysis years results in an adjusted total website page views per developed content title of 8,184 not considered functionally obsolete compared to a total website page views per developed content title of 10,983, or 25 percent. Therefore, based on this method of estimating functional obsolescence, 25 percent of the content titles are considered functionally obsolete.
Based on the two methods discussed above, a functional obsolescence estimate of 20 percent for education related content was selected, as presented in Exhibit 10.

Group 3—Educational Related Content Conclusion
Applying the selected obsolescence estimate of 20 percent to the estimated indicated value before depreciation and obsolescence of $18.1 million results in an indicated fair market value of scientific education ratings content prior to the income tax amortization benefit of $14.4 million.
The income tax amortization benefit was calculated and represents the net present value of the income tax savings resulting from the amortization of the scientific education content value over a 15-year period to be $2.3 million.
The income tax amortization benefit was added to the indicated value of the scientific education content to yield an indicated fair market value of the scientific education ratings content.
Based on the analysis, the indicated fair market value of the scientific education content, using the reproduction cost new less depreciation (RCNLD) method, is $16.7 million, as presented in Exhibit 9.
Group 3—Media Evaluation Content
The media evaluation content consists of 300 titles of science related media reviews. It is understood that the media evaluation content was initially developed by two individuals from the company Media Makers. NNC did not acquire this company, but simply hired the two individuals from it in 2013.
The RCNLD method was applied to estimate the value of the media evaluation content. This analysis is presented in Exhibit 11.

The following are the key inputs for the analysis of the media evaluation content:
- The total annual costs to reproduce the media evaluation content is $1.2 million.
- The number of titles reproduced annually is 100.
- The annual reproduction cost per title is $3,510.
- The total number of titles to be reproduced is 300.
- This resulted in an estimate of total reproduction cost new of $3.5 million.
- A combined developer’s profit and entrepreneurial incentive of 15.0 percent was applied.
- This resulted in an expected return based on the combined developer’s profit and entrepreneurial incentive of $527,000 and an estimated indicated fair market value before depreciation and obsolescence of $4.0 million.
- No information was provided regarding website page views for the media evaluation content. Based on discussions with NNC management, the website page view information from the education content was relied on.
- A functional obsolescence estimate of 20 percent for media evaluation content was selected and used in this analysis.
Group 3—Media Evaluation Content Conclusion
Applying the selected obsolescence estimate of 20 percent to the estimated indicated value before depreciation and obsolescence of $4.0 million results in an indicated fair market value of media evaluation content prior to the income tax amortization benefit of $3.2 million.
The income tax amortization benefit was calculated and represents the net present value of the income tax savings resulting from the amortization of the media evaluation content value over a 15-year period to be $514,000.
The income tax amortization benefit to the indicated value of the media evaluation content to yield an indicated fair market value of the media evaluation content.
Based on the analysis, the indicated fair market value of the media evaluation content, using the RCNLD method, is $3.7 million, as presented in Exhibit 11.
Intangible Asset Valuation Summary and Conclusion—The NNC Subject Assets
As part of the analysis, the three generally accepted approaches to intangible asset valuation were considered: (1) the income approach, (2) the market approach, and (3) the cost approach.
This example relied on (1) the income approach, and specifically the MPEEM; (2) the market approach, and specifically the relief from royalty method; and (3) the cost approach, and specifically the RCNLD method, to estimate the value of the subject assets.
As presented on Exhibit 12, based on the analysis, the fair market value of the NNC subject assets, as of the valuation date is $53.3 million (rounded):
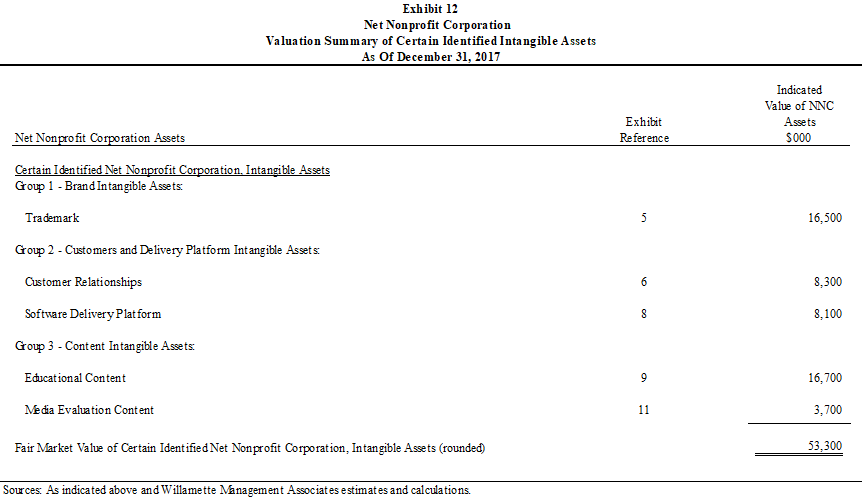
During the analysis of the NNC intangible assets, arms-length royalty rates were estimated for (a) the NNC trademark and use of (b) NNC generated content. Along the way, a 5.0 percent arms-length royalty rate for both the trademark—Group 1 asset—and the NNC generated content—Group 3 assets—were concluded.
Reasonableness Check of the Total Value of the NNC Subject Assets
In order to reconcile and check for reasonableness of the conclusion reached on Exhibit 12. It was necessary to estimate the total value of NNC, under the same hypothetical condition, related to (1) the implied NNC total equity value and (2) the implied NNC total invested capital value. In order to estimate the NNC total equity value, the asset-based approach was used, and specifically the asset accumulation method.
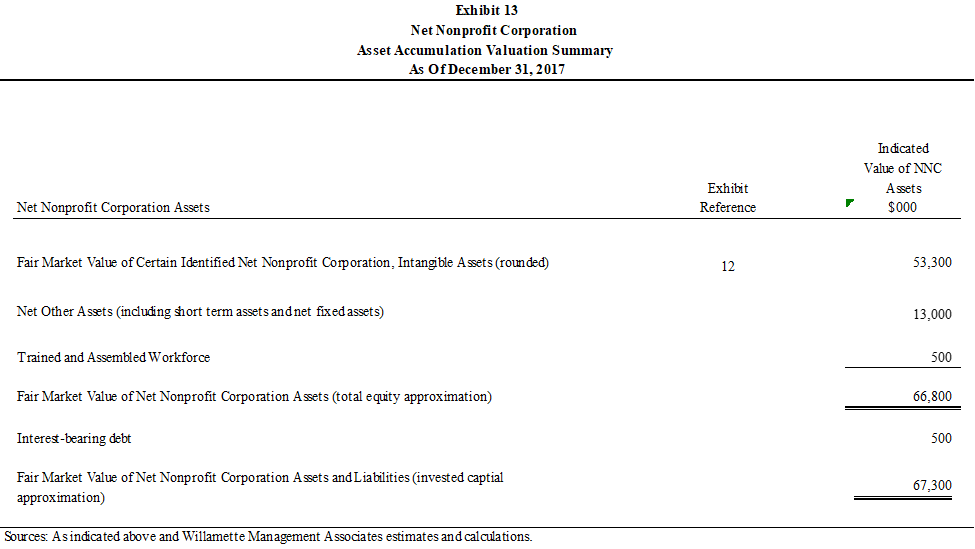
Exhibit 13 presents the calculation of the implied NNC valuation estimate based on the asset accumulation method. In order to arrive at the fair market value of NNC total assets it was necessary to add (1) net other assets—working capital, cash related assets, and fixed assets—and (2) the estimated value of the NNC trained and assembled workforce. These assets were not discretely valued as part of the subject analysis to estimate the value of the NNC subject assets of $53.3 million. Therefore, it was necessary to add $13.0 million of net other assets and $500,000 of trained and assembled workforce value to $53.3 million to arrive at $66.8 million.
Based on the analysis, it is concluded that the implied NNC equity value was $66.8 million, as of the valuation date.
To calculate the implied NNC invested capital value, $500,000 of NNC interest-bearing debt was added to the implied NNC equity value. Therefore, based on the analysis, it is concluded that the implied NNC invested capital value was $67.3 million as of the valuation date.
Application of Reasonable Check Based on Guideline Publicly Traded Company Pricing Multiples
In order to check the total value of the subject assets for reasonableness, the following two procedures were prepared using the guideline publicly traded companies that were selected for benchmarking purposes.
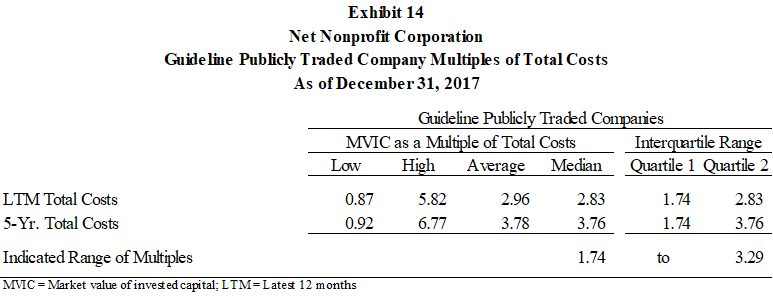
The first procedure is to check the implied NNC equity value and NNC invested capital value compared to total costs. Typically, profitability metrics are used, such as operating income, or earnings before interest and taxes, or earnings before interest, taxes, depreciation, and amortization. However, since NNC is a nonprofit company, there is no direct comparison. Given that NNC’s cost structure is arm’s-length, market-based, guideline publicly traded company multiples based on market value of invested capital (MVIC) to total costs were examined. The results of this analysis are presented in Exhibit 14.
For the next procedure, the total costs multiples implied by the total value of the subject assets were calculated. This is presented in Exhibit 15.
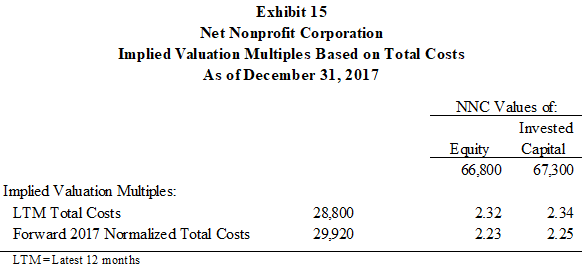
Since the implied valuation multiples in Exhibit 15 fall within the indicated range of multiples of the guideline publicly traded companies in Exhibit 14, this indicates that the total value of the subject assets is reasonable.
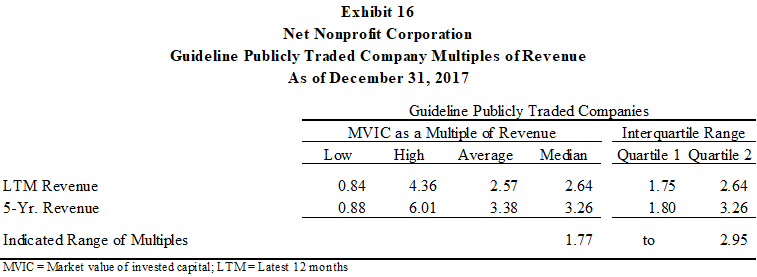
The second procedure is to check the valuation results compared to revenue. In this case, guideline publicly traded company multiples based on MVIC to revenue were used. The results of this analysis are presented in Exhibit 16.
Next, revenue multiples implied by the total value of the subject assets were calculated. This calculation is presented in Exhibit 17.
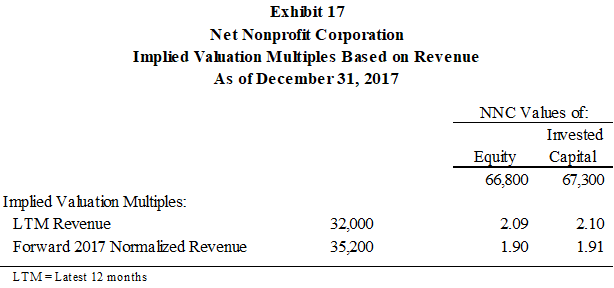
Since the implied valuation multiples in Exhibit 17 fall within the indicated range of multiples of the guideline publicly traded companies in Exhibit 16, this indicates that the total value of the subject assets is reasonable.
Summary and Conclusion
Depending on the valuation assignment facts and circumstances, the analyst may encounter a unique valuation problem: a problem that is well outside the ordinary scope of typical valuation issues.
Analysts are commonly engaged to provide fair market value guidance related to nonprofit business transactions. Nonprofit businesses are often involved in arms-length transactions. However, it is far more common for an analyst to be engaged to estimate an arms-length royalty rate for a nonprofit client than to estimate the value of the nonprofit corporation—or its assets.
To illustrate certain concepts and provide needed context, an example was presented. That example was based on a hypothetical company, Net Nonprofit Corporation. Because NNC is a nonprofit business, the analysis of the subject assets and a reasonableness check of the valuation conclusions were based on the hypothetical condition that NNC was a for-profit business.
In this example, treating the non-profit business as a for-profit business was an essential procedure. It stands to reason that, the most likely acquirer of a non-profit business—or its assets—will be a for-profit business. That reason is due, in-part, to the fact that there are many more for-profit businesses than non-profit businesses. And, for-profit businesses are more likely to buy existing business assets than are non-profit businesses than to develop new assets. Treating NNC as a for-profit business is a hypothetical condition that serves as the basis to apply public market-based evidence in the example analysis. Relevant market-based evidence was used to (1) value certain non-profit intangible assets and (2) check for reasonableness based on the implied total non-profit business value.
As a best practice, it is recommended that more than one method should be used to estimate a value or at least to corroborate a value estimate. The example illustrates how guideline publicly traded companies can be used to corroborate a value conclusion. In the example, a unique application of the guideline publicly traded company method was used. It is considered unique because the application involved the use of cost-based pricing multiples and not earnings-based pricing multiples. The use of cost-based pricing multiples was necessary because NNC did not earn revenue on most of its intellectual property.
This article was previously published in, Willamette Insights, Spring 2019, titled “Fair Market Value Valuations of Not-for Profit Entity Property Transfers”, and is republished here with permission.
Kevin M. Zanni, ASA, CVA, CBA, CFE, CEIV, is a Managing Director at Willamette Management Associates in the firm’s Chicago office. He provides taxation valuation opinions, litigation valuation and damages opinions, fair value valuation opinions, transactional fairness opinions, and solvency opinions. He is the past president of the Chicago Chapter of the American Society of Appraiser and the current president of the Business Valuation Association of Chicago.
Mr. Zanni can be contacted at (773) 399-4333 or by e-mail to kmzanni@willamette.com.
Related posts
-

Can Brands Be Valued Using Relief from Royalty Method Only?
-

Risks and Rewards
-

The Panduit Test
-

Intangible Property and Property Tax Appraisals
-

Economic Obsolescence Measurement Best Practices
-

Economic Obsolescence Measurement Best Practices
-

Economic Obsolescence Measurement Best Practices
-

Will Social Media Marketing Work for You?
