Know your data!
Understanding the data that is applied in an analysis is important. Data that relies on standard industrial classification (SIC) codes can be misleading for industries that have changed—or did not exist—in 1987. As business models and industries evolve, it pays, as Bob Bridges explains in this article, to do a closer analysis.
 Some professionals have stated that the Capital Asset Pricing Model (CAPM) is inappropriate when valuing small privately held companies. However, if the kneejerk reaction is to use the Build-Up Method, some analysts could be running with scissors.
When applying an industry risk premium (IRP) from a major (two-digit) standard industrial classification (SIC) with many companies, outliers would not be expected to have a significant impact on the results. However, when a subgroup (a three- or four-digit SIC code) with only a handful of companies is applied, results can vary based on the companies included. The problem is not the methodology, it’s the data.
The last update for the SIC was in 1987. In 1987 few had a computer and the world wide web did not exist, Mikhail Gorbechev was Time magazine’s Man of the Year, cell phones were rare—except for those who carried a brick, and the number of payphones in the U.S. was years away from reaching its peak. Many businesses and industries have changed considerably over the past 25+ years, so it should be no surprise when companies are not classified to modern expectations.
As businesses are classified under an SIC hierarchy last updated in 1987, understanding which businesses should be included in an SIC is not always straight forward. If the IRP is used without understanding what’s behind the numbers, the opinion could be subject to scrutiny. Many use the Ibbotson IRP Estimates, but it’s important to understand what’s behind the numbers and what companies comprise the reported SIC.
Suppose the subject company is a gas station, and the valuation date is January 1, 2012. Taking a look at Ibbotson’s 2012 Valuation Yearbook, SIC code 554—Gasoline Service Stations—the IRP is 5.36 percent. Thankfully, Ibbotson provides the company names applied in each industry calculation on its website.
Looking at the list of companies for SIC 554…whoa! Who is Vertex Energy? And Alon which owns 7-11 franchises and also operates refineries and asphalt manufacturing? And wait—where are Stripes (Susser) and industry leader Casey’s General Stores? Oh, they are under SIC 541— —Grocery Stores with an industry premium of -3.34%.
Ibbotson considers a comparable company to be an industry “pure play” when its industry revenues are at least 75 percent of the company’s total revenue. So there are two pure play gasoline station chains in SIC 554 (Pantry and TravelCenters) and one in SIC 541 (Casey’s) with IRPs of 5.36 percent and 3.34 percent respectively. That’s a huge difference that can have a material effect on a valuation.
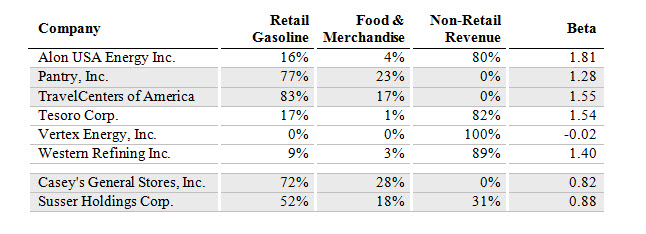
Each company’s food and gasoline revenues, as a percentage of the company’s total revenue, are listed below:
In theory, using the “pure play” companies should have similar results, but that is not always the case. Ibbotson uses the full beta method to determine the IRPs. Full beta is a methodology used to isolate the subject industry betas from other industry betas. This methodology entails calculating each company’s five-year beta, then disaggregating the risk by revenue through regression analysis against the company’s other industry revenues. Lastly, Ibbotson weights each company’s industry beta by market capitalization to determine the industry risk index. The Ibbotson IRP is nearly impossible recreate because it would be necessary divide up the revenue in the exact way as Ibbotson.
Another potential problem is that companies assign their own SIC codes. Companies can select an SIC code that describes the company in the fashion it would like to be seen, as opposed to how an analyst considers it. Analysts who performed equity analysis in the late 1990s would recognize this. During the Internet bubble, some small companies in various industries would try to have technology-related SIC codes, or at least describe their business process as Internet-related in an attempt to gain recognition. Accordingly, the SIC of the company may or may not be an accurate depiction of its operations.
For example, Ibbotson included Vertex Energy, but how much revenue was attributed to gas stations? Vertex Energy, which was formerly World Waste Technologies, Inc., has no gas stations according to its filings. While Ibbotson had reasoning for including Vertex, a valuation analyst is not privy to that reasoning or the magnitude of including it.
As the Ibbotson IRP is created with betas, why not just apply the betas of the companies that are the best fit? Betas are used to determine the industry risk index used for the IRP calculation. Ibbotson has applied the historical ERP in determining the IRP in the formula IRP = (Industry Risk Index x ERP) – ERP. From a systematic risk perspective, this calculation equated the Build-Up Method to modified CAPM.
In selecting companies to include, it’s important to pay attention to the company’s description and its revenue sources. For example, Susser is included with the grocery stores, but derived only 28 percent of its revenue from food and merchandise. Susser’s non-retail revenue is derived from wholesale gasoline sales, so an analyst might want to consider whether to include Susser as an industry pure play. Similarly, TravelCenters has a somewhat different business model than your typical gas station on the corner. So, again, an analyst has to use some judgment to include these as industry pure plays or comparable businesses relative to industry risk for the subject of the valuation.
With the exception of Vertex Energy—that was thinly traded—most of the companies with higher betas generated a majority of their revenue from refining operations. Of course, if Western Refining was included in the beta calculation, then maybe Valero, Delek, Marathon, or Sunoco should be included? These companies could be considered an industry pure play for refining. In contrast, on the grocery store side, companies such as Kroger and Safeway could be considered because they have gasoline sales, but it’s less that 20 percent of their sales. So you are left with Casey’s, Pantry, TravelCenters, and Susser as the gasoline station “pure plays.”
Applying Ibbotson’s market cap weighted methodology for comparison, the IRP is calculated at -0.58% for the pure play gasoline stations in this example:
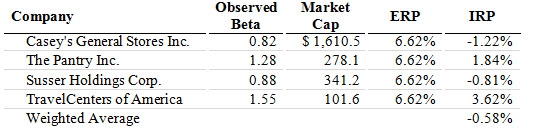
In this instance, there is no difference in the conclusion between modified CAPM and the Build-Up Method using the calculated IRP. Again, the primary difference in the modified CAPM and the Build-Up Method is that the ERP is multiplied by beta to determine an aggregated ERP and IRP, whereas the Build-Up Method adds the ERP to the IRP, which was determined by the full beta methodology. Of course, by using CAPM, the analysis can be further refined by considering capital structure through unlevering and relevering betas.
Keep in mind that this potential pitfall isn’t an issue with Ibbotson. Because SIC 55 major group is “Automotive Dealers and Gasoline Service Stations,” it’s clear this SIC was set up in the days when the local gas station also performed mechanical work. Today, very few gas stations offer mechanical work, but instead focus on food and merchandise revenue. This evolution of a business model can occur in any industry as companies change the way they operate over time. Sometimes, the only answer is to roll up the sleeves and do the analysis.
[divide]
Bob Bridges is a principal with VALUE Incorporated. He holds the Chartered Financial Analyst (CFA) and the Certified Valuation Analyst (CVA) designations. Bob has a master’s degree in economics from Southern Methodist University and also has progressed toward a PhD in economics from the University of Texas at Dallas. Mr. Bridges can be reached at bbridges@valueinc.com and by phone at (972) 831-7923.