Equity Size Premium
Observations and Delaware Fair Value (Part I of II)
This is a two-part article that focuses on empirical evidence supporting the size premium adjustment, observations regarding the CRSP size premium 10th decile category, liquidity issues that may account for the size premium, and certain Delaware Chancery Court decisions involving a size premium discussion. These are discussed since in the past few years there have been numerous fair value business valuation related disputes decided by the Delaware Court of Chancery that involved certain cost of equity capital postulates. Valuation analysts should be aware of potential issues related to incorporating a size premium in the cost of capital estimation in a Delaware fair value matter.

Introduction
Valuation analysts (analysts) often use the Income Approach to value a closely held business enterprise. An important financial variable of the business valuation Income Approach involves the selection of the present value discount rate.
The cost of equity capital is an important component of the present value discount rate. Common equity capital estimation models used in the closely held business valuation process include the build-up rate model and the modified capital asset pricing model (MCAPM).[1]
As a component of these generally accepted models, analysts often include a size premium alpha adjustment factor as part of the cost of equity estimation procedure.
This discussion considers the following topics:
- Empirical evidence supporting the size premium adjustment
- Observations regarding the size premium
- Observations regarding the Center for Research in Security Prices (CRSP) size premium 10th decile category
- Liquidity issues that may account for the size premium
- Certain Delaware Chancery Court decisions involving a size premium discussion
The common formula for the build-up model (BUM) to estimate the cost of equity capital is presented as follows:
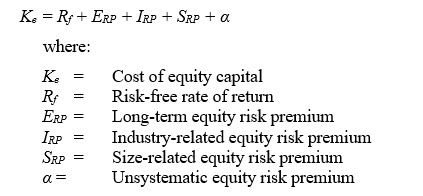
There is consensus among analysts as to the appropriate risk-free rate of return to use in the BUM. Analysts commonly select the market yield on the 20-year U.S. Treasury bond as the risk-free rate of return component. If investment duration is less than 20 years, an analyst may select a risk-free rate of return with an investment duration commensurate with the specific investment duration.
The selected long-term equity risk premium (ERP) is not as consistently applied among analysts. Certain analysts advocate the use of a more normalized equity risk premium, of say five percent. Other analysts elect to use the variables included in the CRSP Decile Size Premium Study published in the 2017 Valuation Handbook-U.S. Guide to Cost of Capital (Valuation Handbook) in Appendix 3.[2]
The Valuation Handbook ERP data is the most commonly cited, providing an estimated ERP premium of around six percent.
Other components of the BUM cost of equity estimate often include an industry-related equity risk premium, a size-related equity risk premium, and an unsystematic equity risk premium. By adding an industry-related risk premium, general industry risk is incorporated in the cost of equity.
This general industry risk premium is not specifically addressed in the long-term equity risk premium component. The industry risk component of the build-up cost of equity capital incorporates systematic risk, in much the same way that beta incorporates industry risk in the capital asset pricing model (CAPM).
The next two components of the BUM are the size-related equity risk premium and the unsystematic equity risk premium. An overview of the size-related equity risk premium is presented further in this discussion.
The unsystematic equity risk premium component is sometimes applied by analysts—the decision to apply this premium should be well supported by the facts and circumstances of the subject analysis. This component is used to incorporate risk that is specific to the subject investment—that is, lack of management talent, potential labor issues specific to the subject company, potential of losing a key client or key personnel, and/or potential cost/risk not identified in financial projections, and so forth.[3] A common argument against using the unsystematic equity risk premium is that, capital market theory suggests that unsystematic equity risk can be diversified away if an investor holds a well-diversified and large portfolio of common stocks.
The basic CAPM formula for estimating the cost of equity capital for publicly traded security analysis is presented as follows:[4]
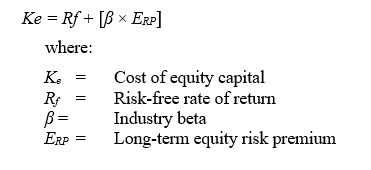
Analysts use many of the same components for the CAPM formula that are used in the BUM. That is, it is common for analysts to rely on the same risk-free rate of return and long-term equity risk premium component factors when presenting both the BUM and the CAPM to estimate the cost of equity. The one distinguishing CAPM factor is beta.[5]
Beta, in general terms, is used to incorporate market risk (general equity risk and industry risk) in an equity cost of capital estimate.
Further adjustments to CAPM include (1) the size-related equity risk premium component and (2) the unsystematic equity risk premium component. By making these alpha adjustments, the CAPM becomes the modified CAPM (or MCAPM).
The MCAPM formula for estimating the cost of equity capital for use in a closely held business valuation is presented as follows:
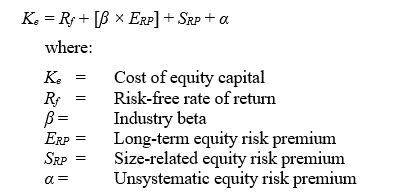
The MCAPM and BUM provide generally consistent and easy to replicate cost of equity capital calculations.
Empirical Evidence Supporting the Size Premium
It is generally accepted that, based on empirical observation, small companies are a greater investment risk than larger companies and, therefore, smaller companies have greater cost of capital than larger companies. In other words, there is a significant (negative) relationship between size and historical equity returns.
It is also generally accepted that small companies have certain risk characteristics that are more prevalent than in larger companies.
These small company risk characteristics include the following:
- Potential competition issues (it is easier to enter the market and compete with small companies, while larger companies have resources to mitigate competitive challenges)
- Economic issues and concern (larger companies can better cope with economic downturn than small companies)
- Limited access to capital (small companies can find it difficult to obtain funding while larger companies typically have more options for funding)
- Management depth concerns (large companies do not have key employee concerns in the same way that smaller companies do)
- Customer concentration and product concentration risk (small companies are typically not as diversified in product offerings and are often beholden to a small group of customers)
- Liquidity concerns and lack of market coverage (small companies do not enjoy the same level of analyst coverage and small company stock is typically less liquid than larger companies)[6]
Rolf Banz, in a 1981 study, is credited and commonly cited for his research focusing on the empirical relationship between equity return and the total market value of New York Stock Exchange (NYSE) common stocks.[7]
According to Banz, smaller firms have higher risk-adjusted returns, on average, than larger firms. For the approximate 40 years covered in the study, on average, small firms recorded larger risk-adjusted returns than large firms traded on the NYSE. The Banz study found that the size effect did not exhibit linear attributes; however, the size effect was found to be more pronounced in smaller firms.
Another noteworthy finding in the Banz study was that the study suggests no theoretical foundation for the size effect. It concluded no determination as to whether the size effect factor is due to size itself or whether size is just a proxy for one or more true but unknown factors correlated with size. According to Banz, the size effect exists but it is not clear why it exists.
The Valuation Handbook is a common source reference for the size premium risk adjustment. The Valuation Handbook provides empirical evidence of the size premium phenomena. It is published as an annual reference book, along with three quarterly updates.
The Valuation Handbook defines the size premium as the difference between actual historical excess returns and the excess return predicted by beta (referred to as the CRSP size premium).[8]
Exhibit 1 presents empirical evidence of the CRSP size premium, as published in the most recent Valuation Handbook.[9]
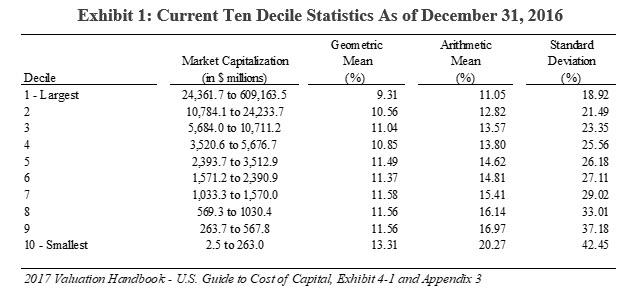
As presented in Exhibit 1, the empirical data illustrates stock market returns by size decile for the 1926 to 2016 time period.[10]
The annual stock market returns are separated into 10 deciles based on market capitalization. As the deciles get smaller, from 1 to 10, the historical stock market returns increase. The standard deviation of stock return portfolios also increases as deciles get smaller.[11] This increase in the standard deviation reflects noise in the data.
A review of Exhibit 1 indicates that the most statistical data noise in the 10th decile stratification is in the 10th decile classification.
Other empirical evidence, in support of the small capitalization size premium adjustment, is provided by international equity market data. For example, in the United Kingdom, a study conducted using its equity markets concluded a small capitalization stock premium of around seven percent.[12] The U.K. study was conducted using equity market data from 1955 to 1984.
In 2015, an equity risk premium analysis study of small capitalization stocks in 23 global markets was conducted by Dimson, March, and Staunton.[13]
In the 23 global equity markets small cap stocks outperformed in every market except for Norway, Finland, and the Netherlands. In general, evidence of the small capitalization stock premium is more prevalent in developed markets than in emerging markets.
Observations Regarding the Size Premium
There are several observations regarding the data used to calculate the size premium adjustment. A few of these observations include the following:
- The small capitalization premium has disappeared in recent years
- A premium is unduly influenced by stocks with less than five million dollars in market capitalization
- The supporting data are too noisy to calculate a meaningful size premium estimate due to the evidence of significant standard errors and seasonality
- There may be other factors than size that contribute to greater small capitalization stock returns compared to large capitalization stock returns, such as:
- bid/ask spread bias
- delisting bias
- transaction costs
- liquidity
It is generally accepted that the small capitalization stock premium was observable prior to 1980. However, it appears that the small capitalization stock premium has decreased since 1981.[14]
The Horwitz study found that during the period of 1963 to 1981, the annualized return difference between small and large firms was greater than 13 percent.[15]
However, the study also found that, during the period of 1981 to 1997. the annualized difference was negative two percent.[16]
Perhaps the reason for the small capitalization stock premium decrease is twofold:
- Market corrections induced by investor understanding of the small capitalization premium phenomena
- External economic and technological changes in the way the securities are bought and sold
As suggested in the Horowitz study, a trend toward passive investing using index funds that give more weight to large capitalization stocks may be a reason for increases in capital gain performance of large capitalization stocks.[17]
Because small capitalization stock performance as compared to large capitalization stock performance over short-term duration is typically more erratic, measurement over a longer term is preferred. For holding measurement periods of one year, five years, 10 years, 20 years, and 30 years, small capitalization stocks outperform large capitalization stocks a majority of the time—measured from 1926 to 2016.[18]
As the measurement periods increase, so does the likelihood of small capitalization stock outperformance of large capitalizations stocks.
Small capitalization stock performance is cyclical, and cyclicality should be expected. Small capitalization stock returns are variable and somewhat volatile. According to one analyst, if small companies always earned more than large companies, then small companies would not be a riskier investment endeavor in the aggregate.[19]
It is also pointed out that bond prices occasionally outperform equities. In 2014, long-term U.S. government bonds outperformed the S&P 500 Index by 10 percent.[20]
Even over a long period of time, which provides the strongest support for the existence of a small cap premium, the Horowitz study found that removing stocks with less than five million dollars in market capitalization causes the small firm effect to vanish.[21]
According to the Horowitz study, the percentage of companies with stock prices of less than two dollars per share was greater in the period of 1982 to 1997 than in the period of 1963 to 1981.[22]
In the smallest decile, 11.7 percent of companies traded at prices less than two dollars a share between 1963 to 1981. In the 1982 to 1997, the percentage of companies traded at prices less than two dollars per share in the smallest decile was 29.7 percent.
In general, historical equity returns exhibit unpredictable variability. Estimates of security risk using historical equity returns reflect noise in the form of large standard errors.[23]
As presented in Exhibit 1, as decile classifications of stock increase—correlated with smaller capitalization stocks—the standard deviation increases. The standard errors by decile class suggest that the small capitalization premium is fragile—almost to the point of lacking statistical significance.[24]
The January effect, seasonality of small capitalization stock returns, is a well-documented phenomenon. The January effect is described as the empirical observation that rates of return for small stocks have, on average, performed better in January than in other months of the year.[25]
In the Horowitz study, the average monthly return in the month of January for small capitalization stocks was 10.20 percent as compared to 0.73 for the average monthly return for February to December.[26]
The Horowitz study calculated the premium using NYSE, AMEX (now NYSE MKT), and Nasdaq stock returns for the period of 1963 to 1997. Other studies have reached similar conclusions. Although the January effect is interesting, it does not disprove that a size premium exists.
It is an unsettled discussion point that the bid/ask spread adds a certain bias to stock returns.[27] This observation is primarily focused on less liquid companies that have larger bid/ask spreads. Most of the small-size effect studies (such as the SBBI equity study prepared by Morningstar and the CRSP equity study prepared by Duff & Phelps) use the CRSP database, which relies on the closing stock price to measure rates of return.
For thinly traded stocks, the ask price is not always a realistic price. Because the small-size effect studies measure size using portfolio returns calculated on a monthly basis, one publication suggests the bid/spread bias issue has only a trivial impact on the small stock premium.
Some observers suggest that a delisting bias exists in the Morningstar decile size premium calculations due to its use of the CRSP database without adjustment.[28]
The reason for this possible bias is because the CRSP database information is allegedly missing prices for certain securities in the period immediately after these certain securities are delisted from a stock exchange.
According to the CRSP, as concluded in a CRSP white paper, the so-called delisting bias is greatly exaggerated.[29]
A few observers have suggested that the size effect is not relevant because various studies have ignored transaction costs in measuring rates of return.[30]
The primary observation is that, small capitalization stocks often have higher transaction costs than large stocks. Because of the higher transaction costs for small capitalization stocks, it is possible that the historical small-stock-related size premium would be reduced if transaction costs and holding periods were factored into the measurement of rates of return.
As published in the Cost of Capital, 5th edition, Ashok Abbott prepared a study of transaction costs by decile for securities listed on the NYSE, AMEX, and the Nasdaq from January 1993 to December 2008. The securities trading cost was estimated as the difference between the daily holding return (closing price to closing price) and the daily trading return (ask price from the previous day to the bid price of the current day).
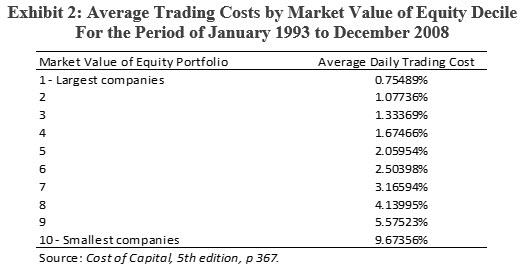
As presented in Exhibit 2, as company size decreases, the average daily trading cost, as a percentage of the trade, increases. The study found that larger firms are traded at lower costs and are subject to less pricing pressure than smaller firms.
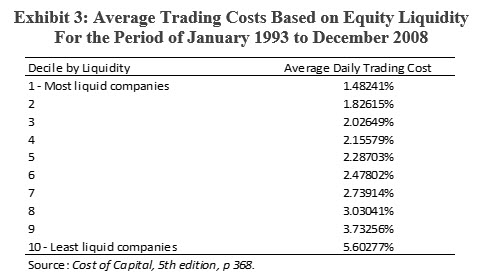
Abbott also prepared an analysis of trading costs as differentiated by liquidity. The results of the Abbott study suggest that as company liquidity decreases, trading costs increase. Another notable finding of the Abbott study indicates that the least liquid stocks comprise the smallest market capitalization size-related decile.
Exhibit 3 presents the Abbott study analysis of liquidity and trading costs.
A discussion of stock liquidity and the equity size premium is presented in more detail below.
Observations of the CRSP Size Premium 10th Decile Category
The companies that comprise the CRSP size premium 10th decile category have equity market capitalizations that range from $2.5 million to $262.9 million. As of December 31, 2016, the risk premium related to the companies comprising the 10th decile was 5.59 percent.[31]
The companies that comprise the CRSP size premium 10th decile are broken down into subcategories 10a and 10b, as presented in the Valuation Handbook. The companies that comprise the 10a subdecile include companies with market capitalizations between $127.3 million and $262.9 million, and the reported size premium is 4.09 percent.[32]
The companies that comprise the 10b subdecile include companies with market capitalizations between $2.5 million and $127.3 million, and the reported size premium is 8.64 percent.[33]
Within the 10a subdecile and 10b subdecile categories of the 10th decile, the Valuation Handbook presents more subcategories. The 10a subdecile is broken into 10w and 10x subdeciles, while the subdecile 10b is broken into 10y and 10z.
Exhibit 4 presents the Valuation Handbook, CRSP size premium 10th decile subdecile category market capitalizations and size premiums subcategory breakdown.

As provided in Exhibit 4, companies that are classified in the CRSP size premium 10th decile vary considerably in market capitalization and applicable size premium. The size premium ranges from 3.10 percent to 11.63 percent, a spread of 8.53 percent, or 853 basis points.
As seen in Exhibit 4, as the size of the company increases, its size premium risk decreases. That is why it is important to correctly interpret and apply the size premium component of the MCAPM—assuming an analyst applies an equity size premium adjustment.
According to the Valuation Handbook, “The CRSP Deciles Size Premia include all companies with no exclusion of speculative (e.g., start-up) or distressed companies whose market capitalization may be small because they are speculative or distressed.”[34]
The distressed company issue can be seen through analysis of the 10th decile subcategories of 10y and 10z.
According to the Valuation Handbook, subdecile 10y includes companies in the fifth percentile with five-year average earnings before interest, taxes, depreciation, and amortization (EBITDA) of negative $22.0 million. Companies classified in subdecile 10y at or below the 25th percentile (lower quartile) reported negative EBITDA.
Similarly, subdecile 10y companies have five-year net income ranging from negative $37.15 million to a positive $11.5 million. Not only are subdecile 10y companies significantly smaller, more than half are unprofitable.[35]
Exhibit 5 presents financial statistics related to the CRSP size premium 10th decile subcategories 10y and 10z as published in Valuation Handbooks for 2014 to 2017.
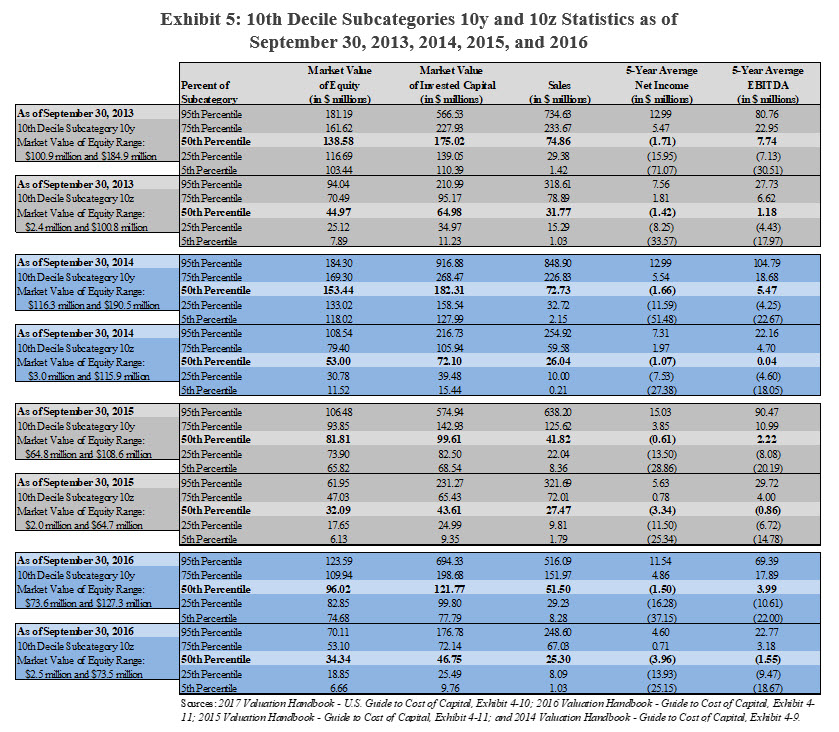
As presented in Exhibit 5, the companies that populate subcategory 10y and 10z are, on average, recording negative net income. In many cases, the companies that populate subcategory 10y and 10z are recording negative EBITDA.
Collectively, this information supports the theory that the CRSP size premium 10th decile is comprised of troubled and distressed companies.
According to James Hitchner in Financial Valuation and Litigation Expert, “It’s important to note that 80 percent of the companies in decile category 10b are from 10z. As such, let’s focus on 10z. At the 50th percentile of 10z the operating margin is –1.11 percent. Yes, on average, these companies are losing money. At the 25th percentile, the operating margin is –21.27 percent. Furthermore, 62 percent of the companies in 10z are from only three industry sectors: financial services, technology, and healthcare.”[36]
As indicated by Hitchner, based on dated information that is still relevant, not only does the CRSP size premium 10th decile include troubled companies, it is skewed by its industry concentration.
A few years back, Morningstar provided some additional detail related to the 10th decile regarding the probability of default of the companies in the 10th decile. Exhibit 6 provides statistics, as published in the Ibbotson SBBI 2012 Valuation Yearbook by Morningstar, of the probability of default of companies in the decile 10 subcategories.
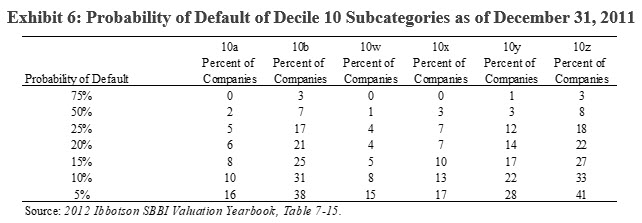
As of December 31, 2011, a little less than 20 percent of subcategory 10b had a 25 percent probability of default. As company size decreases, from subcategory 10w to subcategory 10z, the probability of default increases.
As presented in the Ibbotson SBBI 2013 Valuation Yearbook published by Morningstar, the 10th decile was comprised of significantly more companies in the 10b subcategory than the 10a subcategory.[37] As of December 31, 2002, there were 319 companies populating the 10a subcategory and 1,124 companies populating the 10b subcategory.
Furthermore, as of December 31, 2012, the significant majority of the 10b category was comprised of companies in the 10z subcategory—846 companies in 10z compared to 278 companies in 10y.[38] Of these companies in the 10z subcategory, the majority were financial services businesses.[39]
Also, as presented in the 2013 Ibbotson SBBI Valuation Yearbook, Morningstar changed its methodology for determining the likelihood of company default.
The results of the new methodology were similar to the results of the methodology used for 2012 Ibbotson SBBI Valuation Yearbook. Morningstar concluded that financially distressed companies are more likely to be small equity capitalization stocks.[40]
This article was previously published in Willamette Insights, Autumn 2017, and is reprinted here with permission.
Kevin M. Zanni, ASA, CVA, CBA, CFE, is a Managing Director at Willamette Management Associates in the firm’s Chicago office. He provides taxation valuation opinions, litigation valuation and damages opinions, fair value valuation opinions, transactional fairness opinions, and solvency opinions. He is the past president of the Chicago Chapter of the American Society of Appraiser and the current president of the Business Valuation Association of Chicago.
Mr. Zanni can be contacted at (773) 399-4333 or by e-mail to kmzanni@willamette.com.
[1] There are many other cost of equity capital estimation models, including: (a) the Duff & Phelps, LLC, Risk Premium Report Model; (b) arbitrage pricing theory model; and (c) Fama-French three factor model.
[2] CRSP is an acronym for Center for Research in Security Prices. The Valuation Handbook is a continuation of the previously produced SBBI Valuation Yearbook by Morningstar. The Valuation Handbook is produced by Duff & Phelps.
[3] Unsystematic risk is defined as the portion of total risk that is specific to an individual security and can be avoided through diversification. Shannon P. Pratt, Valuing a Business: The Analysis and Appraisal of Closely Held Companies, 5th ed. (New York: McGraw-Hill, 2008), 1075, Appendix A.
[4] CAPM is defined as a model in which the cost of capital for any stock or portfolio of stocks equals a risk-free rate plus a risk premium that is proportionate to the systematic risk of the stock or portfolio. Pratt, Valuing a Business, 1070, Appendix A.
[5] Beta is defined as a measure of the systematic risk of a stock; the tendency of a stock’s price to be correlated with changes in a specific index. Pratt, Valuing a Business, 1070, Appendix A.
[6] Roger J. Grabowski, “The Size Effect—It Is Still Relevant,” Business Valuation Review 35, no. 2 (Summer 2016): 63.
[7] Rolf W. Banz, “The Relationship Between Return and Market Value of Common Stocks,” Journal of Financial Economics 9 (March 1981): 3–18.
[8] Duff & Phelps, 2017 Valuation Handbook: U.S. Guide to Cost of Capital (New York: John Wiley & Sons, 2017), 2–14.
[9] The Valuation Handbook presents an alternative size premium analysis, the Risk Premium Report. The Risk Premium Report is not discussed herein.
[10] Annual stock market returns represent the combined annual stock returns of stocks listed on the New York Stock Exchange (NYSE), NYSE Euronext, and Nasdaq.
[11] The standard deviation is a measure that is used to quantify the amount of variation or dispersion of a set of data values. A low standard deviation indicates that the data points tend to be close to the mean of the set, while a high standard deviation indicates that the data points are spread out over a wider range of values. J.M. Bland and D.G. Altman, “Statistics Notes: Measurement Error,” The BMJ 312 (7047) (September 1996): 1654.
[12] Aswath Damodaran, “Equity Risk Premiums (ERP): Determinants, Estimation and Implications—The 2015 Edition,” Stern School of Business whitepaper (March 2015): 37.
[13] Ibid.
[14] Aswath Damodaran, “The Small Cap Premium: Where Is the Beef?” Business Valuation Review 34, no. 4 (Winter 2015): 153.
[15] Joel L. Horowitz, Tim Loughran, and N.E. Savin, “The Disappearing Size Effect,” Research in Economics 54, no. 1 (2000): 87.
[16] Ibid.
[17] Ibid., 96.
[18] Duff & Phelps, 2017 Valuation Handbook: U.S. Guide to Cost of Capital, 4–6.
[19] Grabowski, “The Size Effect—It Is Still Relevant”: 65.
[20] Ibid.
[21] Damodaran, “The Small Cap Premium: Where is the Beef?”: 154.
[22] Horowitz, Loughran, and Savin, “The Disappearing Size Effect.”
[23] Damodaran, “The Small Cap Premium: Where is the Beef?”: 154.
[24] Ibid.
[25] Roger Grabowski and Shannon Pratt, Cost of Capital, 5th ed. (New York: John Wiley & Sons, 2014), 363.
[26] Horowitz, Loughran, and Savin, “The Disappearing Size Effect”: 87.
[27] Grabowski and Pratt, Cost of Capital, 364.
[28] Ibid., 365.
[29] Ibid.
[30] Ibid., 366.
[31] Duff & Phelps, 2017 Valuation Handbook: U.S. Guide to Cost of Capital, Appendix 3.
[32] Ibid.
[33] Ibid.
[34] Ibid., 4–12.
[35] Ibid., 4–13.
[36] Jim Hitchner, “How to ‘Rig’ a Valuation: The Discount Rate,” Financial Valuation and Litigation Expert (February/March 2013).
[37] 2013 Ibbotson SBBI Valuation Yearbook (Chicago: Morningstar, 2013), 90.
[38] Ibid.
[39] Ibid., 91.
[40] Ibid., 100.


