In Related-Party Cost Sharing Arrangements (Part I of II)
This two-part paper demonstrates how the discount rate associated with the investment in intangibles developed under a cost sharing arrangement can be calculated using an analytical framework that explicitly considers variability of outcomes in profitability of the intangibles to be developed. Such framework is the probability-weighted scenario analysis. The method of calculating discount rates using the scenario analysis can be applied to compute the PCT payment under both the “income method” and the “residual profit split method” described in the U.S. transfer pricing regulations. The same method also allows to calculate compensation of an entity that funds the CSA activities. This paper illustrates application of the proposed technique and provides comparisons with the example of the income method application discussed in the U.S. transfer pricing regulations.

1. Introduction
Cost sharing arrangements (CSAs)[1] may cause intense scrutiny from tax authorities. In the U.S., disclosure of an existing CSA by a taxpayer automatically leads to an elevated (Tier 1) level of the tax audit and may lead to further controversy. As demonstrated by the Veritas and Amazon Tax Court cases, much of the debate related to CSAs revolves around the validity of assumptions and calculations used to establish the payment for the pre-existing (or platform) intangibles. The recently released Organization for Economic Co-operation and Development (OECD) discussion draft on cost contribution arrangements[2] similarly places the onus on taxpayers to carefully prepare and document the assumptions and projections that were used to value the contributions made by the participants in such an arrangement and the benefits expected by each participant.
Discount rates play an important role in the analysis conducted under the framework of the U.S. Treasury Regulations §1.482-7 (CSA Regulations) that discuss methods to determine taxable income in context of CSAs. For instance, appropriate discount rates need to be selected under the “income method”[3] to determine the compensation for the platform contribution (i.e., PCT Payment, formerly known as buy-in). The income method is likely to be found the best method for calculating the PCT Payment in cases when rights for further development of internally developed (as opposed to acquired) intangibles are transferred to an affiliate that does not make non-routine platform contributions, particularly when shares of the transferor are not publicly traded or when the cost shared intangibles do not support substantially all of the transferor’s activities.[4]
Under the income method, the PCT Payment is evaluated by reference to the “licensing alternative.” The licensing alternative defined in the CSA Regulations describes a hypothetical scenario where, instead of entering a CSA, the owner of the preexisting platform intangibles undertakes further intangible development activities on its own absorbing the full cost and risk of the intangible’s development. At the same time, the related party that would have entered the CSA (i.e., the PCT Payor) is relieved of paying the intangible development costs in exchange for paying royalties for the fully-fledged intangibles to their developer.[5]
The guidance provided in the CSA Regulations with respect to discount rates refers to “market information” as the most reliable way to determine these rates.[6] The CSA Regulations further posit that developing intangibles and licensing them out “may be riskier for the licensor, and so require a higher discount rate.”[7] Conversely, “a party may have less risk as a licensee of intangibles needed in its operations, and so require a lower discount rate, than it would have by entering into a CSA to develop such intangibles.”[8] The connection between the discount rates used for the licensing and cost sharing alternatives is also established in the method of valuing the PCT Payment that relies on the “differential income stream.”[9]
This paper demonstrates calculation of discount rates for intangibles development activities in the CSA context based on the scenario analysis. Scenario analysis technique is commonly used by some MNCs to evaluate best investment alternatives, including investments in the development of new intangibles, and particularly in cases when the required amount of investment is high, the payoff is uncertain, and several milestones need to be achieved before the full realization of the payoff. This paper argues that in certain situations, it may be prudent for taxpayers to apply scenario analysis in the CSA context not only to determine a discount rate but also to calculate a PCT Payment and to demonstrate to the tax authorities, who typically examine outcomes of CSAs after the fact, the diligence that went into preparing the CSA.
2. Organization of the Remainder of the Paper
Section 3 presents an empirical evidence (by way of Exhibit A) suggesting that discount rates calculated using conventional techniques may not always provide empirical support to one of the key assumptions of the income method as described in the CSA Regulations, namely that the intangibles development activities are riskier for the licensor than exploitation of licensed intangibles is for the licensee. This finding calls for a more robust alternative method. Section 4 describes an alternative method of computing discount rates for the intangibles development activities that explicitly considers the variability of outcomes in profitability of the intangibles to be developed and the correlation of returns on intangibles development activities with the market returns. This method is based on the probability-weighted scenario framework. Examples of implementing the analysis described in Section 4 are presented in Exhibits B though E. Exhibit B provides an outline of the scenarios used throughout the rest of this paper. The scenarios presented in Exhibit B are constructed around the fact pattern and the financial projections discussed in CSA Regulations §1.482-7(g)(4)(viii), Example 1 (CSA Regulations Example). Using the CSA Regulations Example as the starting point (i.e., the base case), the scenario analysis provides an easy cross-reference between the results obtained in the CSA Regulations and those calculated in this paper. The theoretical basis for computing the discount rate under the scenario analysis framework is discussed in Section 5. Exhibit C demonstrates calculation of the mean and standard deviation of the IRRs obtained from the different cost sharing scenarios presented in Exhibit B and use of these parameters in determining a discount rate applicable to cost sharing activities. Section 6 demonstrates that the scenario analysis is consistent with the licensing alternative premise of the CSA regulations, and Exhibit D provides a corresponding illustration. Section 7 discusses the calculation of the PCT Payment under the scenario analysis framework, and Exhibit E demonstrates the PCT Payment calculation based on the scenarios developed in this paper and compares the resulting PCT Payment with the one obtained in the CSA Regulations. Section 8 provides concluding remarks.
3. Relationship Between Cost of Capital and Risk: Empirical Findings
One of the most used measures of the discount rate in valuation analysis is the Weighted Cost of Capital (WACC). Some of the main advantages of WACC are that it is based on the market data and is straightforward to calculate. However, in order for WACC to be a reliable measure of the discount rate in the CSA context, empirical observations must consistently and reliably demonstrate that the firms assuming greater risks such as those regularly engaging in development of unique and valuable intangibles have higher WACCs than firms that do not normally engage in development of such intangibles thereby assuming lower risks.[10]
To test this proposition empirically, I selected three industries with publicly available data for both the firms that develop new technologies on a regular basis and manufacturing or distribution firms that do not own non-routine (i.e., unique) intangibles. These selected industries were the electronics, pharmaceutical, and automotive industries. The results of the analysis are shown in Exhibit A.
The WACC of a publicly traded firm is a function of market rates of return (i.e., the risk free rate, the risk premium, and the cost of debt), the firm-specific correlation of its stock price with the market portfolio, or “beta,” and the capital structure of the firm. Aside from capital structure, the unique parameter that determines the cost of a firm’s capital is its beta. The effects of differences in capital structure can be eliminated by “unlevering” to isolate the impact of the firm’s unique characteristics other than its capital structure on the firm’s cost of capital.[11]
If owners of non-routine intangibles were to earn a consistently higher return on capital than “routine” firms, one would expect to observe higher unlevered betas for the “non-routine” companies than for the routine companies in the same industry. Yet, the empirical results, presented in Exhibit A do not support this conclusion and show instead that within the same industry, owners of non-routine intangibles, as a group, do not have uniformly higher unlevered betas than the group of companies engaged in routine manufacturing or distribution activities.
Thus, the conventional method of calculating discount rates that relies on the market-observed inputs in the WACC formula may not always provide a reliable empirical support for a key assumption of the income method, namely that intangibles development activities are riskier for the licensor than is the exploitation of licensed intangibles for the licensee.
Nonetheless, the proposition that development of intangibles is riskier than exploitation of the same intangibles rings true for many entrepreneurs and practitioners.
The absence of strong evidence supporting systematic differences in the cost of capital between entities engaged in activities associated with different levels of risk obtained by conventional methods calls for an alternative method for measuring risk, one that accounts directly for the varying risks of different activities in the context of a CSA, that is based on market evidence, and that is consistent with the premises of the CSA Regulations. Such alternative method may be based on the technique of probability-weighted scenario analysis.[12]
Exhibit A. Comparison of the Unlevered Betas
Between Owners of Non-routine and Routine Intangibles
I began by selecting companies in the electronic, pharmaceutical, and automotive industries listed on public stock exchanges in the North America. These companies were then divided into three subgroups per industry: owners of non-routine intangibles (referred to further as OEMs for simplification), routine manufacturers, and routine distributors. Each company’s data on beta and capital structure were then collected, and unlevered betas were computed.[13] The list of companies selected and their betas are available from the author upon request.
To determine whether, within the same industry, the subgroups of routine manufacturers and distributors exhibit unlevered betas that are significantly different from the unlevered betas of the OEM subgroup, I performed a conventional t-statistic test designed to determine whether two samples of random variables belong to the distribution with the same mean and variance.[14] The statistics of each sample and the results of this test are summarized in Table A.1. and Table A.2.
Table A.1.: Statistical Properties of the Sample of Unlevered Betas
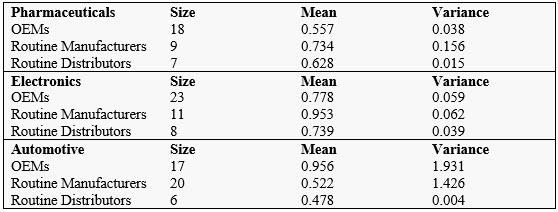
Table A.2.: Comparison of Unlevered Betas Between OEMs and Routine Companies
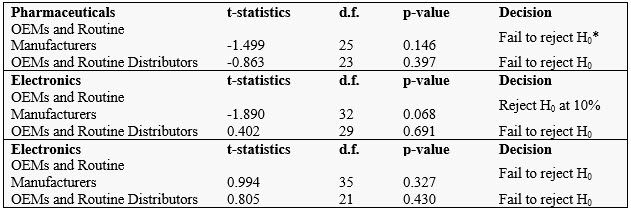
* H0 is a statistical hypothesis that unlevered betas of the two samples are drawn from the same normal distribution.
The test failed to reject the statistical hypothesis that the mean unlevered beta of the OEM sample is the same as the mean unlevered beta of the samples of routine manufacturers and/or distributors at the 95% confidence level for all industries. Comparison of the mean of unlevered betas of the electronic OEMs to the same metric for the routine electronics manufacturers demonstrated that the mean unlevered beta for the OEMs is statistically lower than that of routine manufacturers with 90 percent confidence.
The unlevered betas capture correlations of the company’s stock price with the market portfolio isolated from the impact of the companies’ capital structure. Thus, the difference between unlevered betas for any two companies translates into the difference in the cost of capital of these companies if the cost of capital is computed using the WACC formula. The lack of statistical difference between the unlevered betas of the OEMs and companies performing routine functions within the same industry provides empirical evidence that the cost of capital for firms engaged in the riskier activities (i.e., OEMs) is not generally higher than the cost of capital for the firms engaged in the less risky, routine activities.
4. Probability-Weighted Scenario Framework
The probability-weighted scenario analysis was originally developed for use in project financing and capital budgeting, where it found a widespread acceptance. In the transfer pricing field, however, scenario analysis is used relatively rarely, although an application of capital budgeting process to decision-making in the context of options realistically available was demonstrated by Jie-A-Joen and Moerer (2010).[15]
Scenario analysis is most useful in cases when the net present value of a given investment (or the investment payoff) actually realized can vary significantly from the anticipated value due to the effect of various unforeseen events or “shocks.” Shocks associated with the development and exploitation of intangibles may stem from various uncertain factors affecting projected profits such as development lead time, the nature of developed intangibles, possibility of competitive entry in the future, changes in the future market demand conditions, etc. In the context of modeling cash flows under CSAs, shocks can either affect the realization of the operating profit attributable to the intangibles or the cost of intangibles development or both. The impact of shocks on the value of intangibles contemplated for development under a CSA can be modeled directly using a probability-weighted scenario analysis. This technique involves developing a range of alternative scenarios incorporating various realizations of the future income from intangibles, assigning probability to the realization of each scenario, and observing the statistical properties (i.e., mean and standard deviation) of the resulting distributions of the parameters that describe the intangibles’ values, such as the net present value (NPV) or internal rate of return (IRR).[16] A scenario analysis conducted to establish the discount rate in the context of a CSA will, in general, comprise the following steps:
- For intangibles contemplated for development under a CSA, prepare alternative calculations of future operating profits earned by all CSA participants on a worldwide basis taking into account various possible realizations of future revenues, costs of materials, operating costs, intangible development costs (IDCs), and routine returns.
- Compute the IRR of after-tax residual profit realization for each of the scenarios. The IRR in this setting is equivalent to the return on capital invested in the intangible’s development activities.
- Compute the mean and standard deviation of the sample of IRRs obtained from each scenario.
- Use the standard deviation of the IRR sample from step 3 as an input to calculate the discount rate for the intangibles development activities within a CSA under the CAPM framework.
- The same discount rate as developed in step 4 should be applied to calculate the PCT Payment and to compute the effective royalty rates for the PCT Payor as implied by the licensing alternative.
Calculations of the discount rate based on the scenario framework can be made either with discrete scenarios or using probability distributions of the financial data that comprise the most likely “base case” CSA forecast. In the latter case the calculations can be aided by software capable of performing Monte Carlo simulations.
Exhibit B
The Scenario Analysis Example
The fact pattern discussed in the CSA Regulations Example (§1.482-7(g)(4)(viii), Example 1) is as follows.
USP, a software company, has developed version 1.0 of a new software application that it is currently marketing. In Year 1 USP enters into a CSA with its wholly-owned foreign subsidiary, FS, to develop future versions of the software application. Under the CSA, USP will have the rights to exploit the future versions in the United States, and FS will have the rights to exploit them in the rest of the world. The future rights in version 1.0, and USP’s development team, are reasonably anticipated to contribute to the development of future versions and therefore the rights in version 1.0 and the research and development team are platform contributions for which compensation is due from FS as part of a PCT. USP does not transfer the current exploitation rights in version 1.0 to FS. FS will not perform any research or development activities and does not furnish any platform contributions nor does it control any operating intangibles at the inception of the CSA that would be relevant to the exploitation of version 1.0 or future versions of the software.
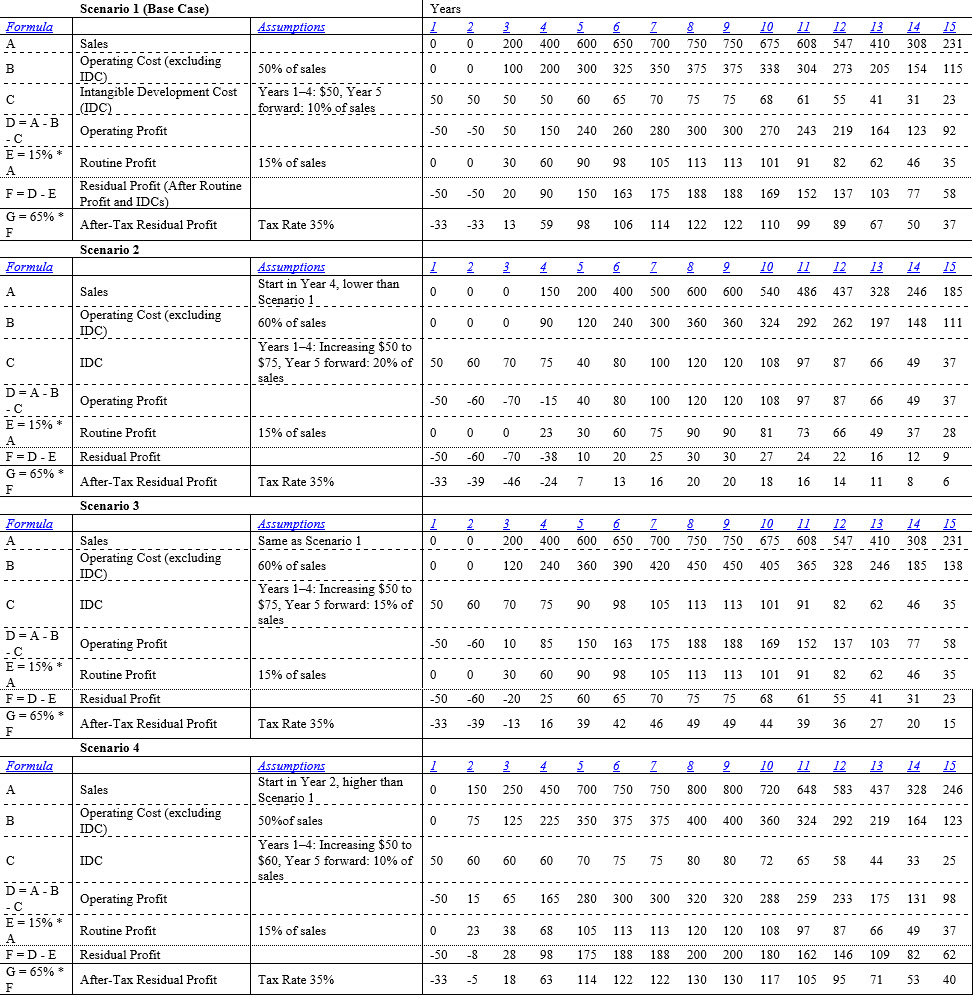
I have incorporated the financial projections from this example into Scenario 1, which serves as the base case (i.e., most likely scenario), except that two additional assumptions were made: (i) the arm’s length compensation received by FS for its routine contributions is 15% of revenue (based on the observation that operating profits of FS under the licensing alternative presented in the CSA Regulations Example provide FS a 15% return on sales for each year of sales) and (ii) the tax rate on FS profit is 35%.
Next, I constructed three additional scenarios, as follows:
- Scenario 2 incorporates a less successful outcome of the cost-shared intangibles development. Under this scenario, sales of the future versions of software start one year later than projected in the base case, and do not reach the base case volumes. Operating costs, excluding IDCs, in this scenario are 60% of sales, i.e., higher than 50% of the base case scenario. Development costs are assumed to be higher than in the base case.
- Scenario 3 assumes the same sales as the base case scenario but higher-than-expected operating costs and IDCs. Under this scenario, operating costs, excluding IDCs, are 60% of sales, and IDCs are higher than in the base case scenario.
- Scenario 4 assumes earlier-than-expected intangible development cycle and a greater-than-expected market success of the products. Under this scenario, sales of the future software versions start in year 2 (as opposed to year 3 of the base case scenario), and sales volumes exceed the base case projections in each year. IDCs in years 2 through 4 rise faster than in the base case, yet, similar to the base case, IDCs in years 5 and thereafter are assumed to be 10% of sales. Operating costs, excluding IDCs are assumed to be 50% of sales, i.e. the same proportion as in the base case scenario.
The financial details of these scenarios are shown below.
The assumed probabilities of realization for each scenario are presented below.
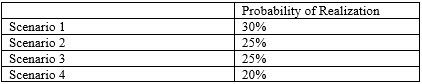
Discounting the operating profit of FS in each scenario (line D) at an assumed 15% discount rate (the same rate as used in the CSA Regulations Example) and applying to each scenario the probabilities of realization assumed above, the probability-weighted net present value of the cost sharing alternative is $629 million as compared to $889 million calculated in example provided in the CSA Regulations.
Reproduced with permission from Tax Management Transfer Pricing Report, Vol. 24 No. 4, 6/25/2015.
Copyright 2015 by The Bureau of National Affairs, Inc.; (800) 372-1033; http://www.bna.com
Dr. Vladimir Starkov is a vice president at NERA Economic Consulting. The author would like to thank Harlow Higinbotham and Patrick Breslin for their review and helpful comments. Any remaining errors are author’s own. The views and opinions presented in this paper are those of the author and not of NERA Economic Consulting.
Dr Vladimir Starkov is an economist and a testifying expert specializing in transfer pricing and asset valuation. He has provided consulting services for multinational companies, closely held businesses, tax authorities, attorneys, and other clients. His experience encompasses a variety of industries, including AgroSciences, automotive, banking, biotechnology, high technology, consumer electronics, manufacturing of consumer and industrial products, electric utilities, pharmaceuticals, petrochemicals, retail, and others.
Dr. Starkov has participated in engagements involving various tax controversy proceedings, including negotiation and implementation support for unilateral and multilateral Advance Pricing Agreements (APA) with tax authorities in North America, Asia, and Europe, design of intercompany pricing methodologies, valuation of intangible property transferred in intercompany transactions, including cost sharing arrangements, and preparation of transfer pricing documentation, including master files and local files for different jurisdictions. Dr. Starkov has conducted business valuation and valuation of intangible assets held by multinational businesses. He analyzed stock option compensation and consulted on strengthening banks’ internal controls. Dr. Starkov has submitted policy advice to the Organization for Economic Co-operation and Development (OECD) on various aspects of transfer pricing rules and testified at OECD public consultation meetings. Over the course of his career, Dr. Starkov has authored whitepapers and bylined articles, and delivered speeches on various topics related to the valuation of intangibles and transfer pricing.
Dr. Starkov holds a PhD and MA in economics from West Virginia University, and an MS in environmental engineering from Mendeleyev University of Chemical Technology, Russia.
Dr. Starkov holds CVA and MAFF credentials from the National Association of Certified Valuators and Analysts (NACVA).
Dr. Starkov can be contacted at (312) 573-2806 or by e-mail to Vladimir.Starkov@NERA.com.
[1] CSAs are arrangements that enable taxpayers to share the costs and risks of developing intangible assets with other related parties in exchange for granting to those related parties rights in intangibles being developed. Typically, rights to use pre-existing intangibles for their further development are also granted to related parties in exchange for a separate “buy-in” consideration.
[2] BEPS Action 8: Revisions to Chapter VIII of the Transfer Pricing Guidelines on Cost Contribution Arrangements (CCAs), Public Discussion Draft, OECD, April 29, 2015.
[3] §1.482-7(g)(4).
[4] This paper takes the income method described in the CSA Regulations as given, although some recent publications question consistency of the income method with the arm’s length principle (e.g., R.B. Schrotenboer. “IRS Determination of Reasonably Anticipated Benefits Duplicates Income of Preexisting and Future Intangibles,” Tax Management Transfer Pricing Report, Bloomberg BNA, 3/19/2015).
[5] See, for example, §1.482-7(g)(2)(iii) along with provided examples and references.
[6] §1.482-7(g)(2)(v)(A).
[7] §1.482-7(g)(2)(v)(B)(1).
[8] Ibid.
[9] §1.482-7(g)(4)(v).
[10] In certain situations, the cost of equity would be preferred to WACC as a discount rate, especially in cases where development of intangibles would be funded only by equity at arm’s length. The subsequent discussion applies equally well when the cost of equity is used as a discount rate instead of WACC because in the same market for the same time period the differences in the cost of capital depend mainly on beta, which is part of both the cost of equity and the WACC formulas.
[11] For the discussion of the “unlevering” technique, see, for example Brealey and Meyers “Principles of Corporate Finance”, 7th ed., Ch. 19, p. 535.
[12] A textbook discussion of the scenario analysis (also known as sensitivity analysis) can be found in Peterson, P.P. and Fabozzi, F. J. “Capital Budgeting: Theory and Practice”, Wiley, 2002.
[13] Levered betas were computed using 60 monthly stock prices from January 2010 to December 2014 regressed against the S&P 500 Index. The levered betas were converted to the unlevered betas using the data on the market value of equity and book value of debt as of 12/31/2014.
[14] This test works as follows. Assume that the two samples of normally distributed random variables X and Y contain n and m observations respectively. The means of the samples are avg(X) and avg(Y), and the variances are s12 and s22. If the two samples are drawn from the same normal distribution, the respective first and second moments of the two populations must be the same. This hypothesis can be tested with the following statistic
T = ,
which has a t-distribution with n + m – 2 degrees of freedom.
[15] Jie-A-Joen, C. and Moerer, O. “A Note On Options Realistically Available,” BNA Tax Management Transfer Pricing Report, 6/17/2010.
[16] IRR is a discount rate that sets the net present value of a given cash flow to zero.