A Case Study
In articles published in The Value Examiner, “A Hybrid Approach to Estimating Company Specific Risk,” and “A Hybrid Approach to Determining Company Specific Risk: Using Monte Carlo Simulation,” the author explains the theoretical basis for using a company specific risk premium in the build-up method and presents a methodology for developing the company specific risk premium. Then he shows how to incorporate Monte Carlo simulation into the model. The model is a variation of David Wood’s MUM for allocating personal and business goodwill and the risk rate component model. The following article is a review of some basic concepts.

In previous articles, “A Hybrid Approach to Estimating Company Specific Risk”[1] and “A Hybrid Approach to Determining Company Specific Risk: Using Monte Carlo Simulation,”[2] I explained the theoretical basis for using a company specific risk premium in the build-up method and presented a methodology for developing the company specific risk premium. Then I show how to incorporate Monte Carlo simulation into the model.[3] The model was a variation of David Wood’s MUM for allocating personal and business goodwill, and the risk rate component model.[4] The following is a review of some basic concepts.
A multi-attribute utility theory model (MAUT) is a decision-making tool that helps people make choices when there are multiple factors to consider. It does this by assigning a utility value to each factor and then calculating the overall utility of each choice based on the values of the individual factors. In using MAUT to develop a company specific risk premium (CSRP), the steps are:
- Identify those attributes that may impact the CSRP,
- Determine the importance (IU) of those attributes to the subject company, and
- Determine the extent (EU) to which those attributes impact the CSRP.
- Determine the multiplicative utility (MU = IU X EU) for each attribute.
- Determine the total multiplicative utility (TMU).
- Determine where the TMU falls within a range of potential outcomes. The result is the CSRP.
A Monte Carlo simulation is used to model the probability of different outcomes in a process that cannot easily be predicted due to the intervention of random variables. It is a technique used to understand the impact of risk and uncertainty.[5] The model was developed in the 1940s by scientists and mathematicians working on the Manhattan Project.[6] Monte Carlo simulation is an accepted methodology in the courts. Provided that the expert is able to explain and support their assumptions.
With Monte Carlo simulation, we are able to incorporate the impact of uncertainty into our financial model. In applying Monte Carlo simulation, we identify one or more variables for which the actual value may be uncertain. We define the variable using a random number function. To run the Monte Carlo simulation, we run multiple simulations and average the results.
In building a Monte Carlo simulation to reflect variable risk, it is necessary to give thought to how the risk might vary and whether one expects risk to be symmetrically distributed or skewed.
Behavioral economists have used loss-aversion theory, also known as prospect theory, to explain investor behavior. Loss aversion in behavioral economics refers to a phenomenon where a real or potential loss is perceived by individuals as psychologically or emotionally more severe than an equivalent gain. For instance, the pain of losing $100 is often far greater than the joy gained in finding the same amount.[7]
In developing the company specific risk premium, this means that a potential buyer is more likely to place greater weight on a negative risk factor than a positive risk factor. The degree to which a specific risk factor is weighed is not symmetrical. To understand this better let’s look at the hybrid MAUT model for developing company specific risk.
The following is one section of the 36 risk attributes identified. Let’s look at how the attribute, “Supply stability,” applies to the subject company:
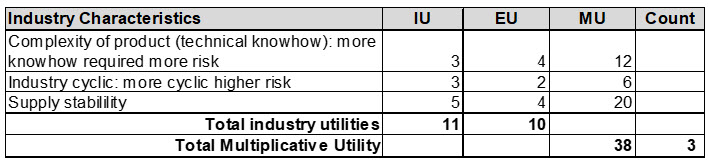
The IU is the importance utility. This is the importance of the specific attribute to the ability of the company to achieve the expected cash flows. The range of the IU attributes is 1, 3, and 5. In this example, the supply stability has an attribute of 5 meaning that supply stability is very important to the company being able to produce its product. The EU is the expected risk relating to the supply stability attribute. The range of possible EUs used in this model is 0, 1, 2, 4, 7. With 0 being no significant risk, to 7 being very high risk. In this case, there is instability in the supply chain, but thus far the company has been able to obtain the product it requires. It was determined that the most likely supply chain risk is 4. However, there is a chance that the supply chain could become totally disrupted. In which case, the risk factor would be 7. This is the high range. There are also signs that the supply chain will improve and the product supply will become more stable. In this case, the EU is determined to be 2. This is the low range. The above weightings place greater weight on the possible negative outcome (plus 3) than the possible positive outcome (minus 2).
This type of analysis can be done for each attribute or just certain attributes for which there is greater uncertainty. This will be based on your knowledge of the company and industry, and your professional judgment. This analysis is essential when we apply Monte Carlo simulation to the model.
To apply Monte Carlo simulation, a random triangular skewed distribution is used. A triangular distribution assumes an upper limit (best or high case), a lower limit (worse or low case), and a mode (most likely case). “A triangular distribution is a continuous probability distribution with a probability density function shaped like a triangle. It is defined by three values: the minimum value a, the maximum value b, and the peak value c. This is handy, as in a real-life situation we can often estimate the maximum and minimum values, and the most likely outcome, even if we do not know the mean and standard deviation. The triangular distribution has a definite upper and lower limit, so we avoid unwanted extreme values. In addition, the triangular distribution is a good model for moderately skewed distributions.”[8]
In my MAUT model for estimating company specific risk, I have 36 attributes. If you recall, the valuation analyst estimates the IU (importance of the risk factor) and EU (expected risk, i.e., degree to which risk contributes to overall company specific risk) for each risk attribute. The IU X EU = MU (multiplicative utility). The sum of the MUs is the total multiplicative utility (TMU).
The random triangular distribution is applied to the TMU. To do this, the MAUT worksheet must be completed three times. The first is what the valuation analyst thinks is the most likely outcome. The second is the worst-case scenario. The third is the best-case scenario.
This is explained in detail in the articles referred to above. The following is a case study of a hypothetical company. It demonstrates how the risk analysis might be done.
Case Study: Analog Electronics
Analog Electronics (Company) is a New England company founded by Asa in the 1940s. Asa was a pioneer in developing technology to convert waves to electronic signals. The Company’s products continue to use analog technology as digital technology is not accurate enough for certain applications. Products are manufactured for both military and commercial use. The Company does approximately $10 million in sales annually. Asa Jr. succeeded Asa Sr. and currently runs the Company. Asa Jr. has an engineering degree and is the technological guru for the Company. Asa Jr.’s daughter, Asia, is taking over the business and will be gifted Asa, Jr.’s stock in the Company. The valuation is for gift tax purposes.
In addressing the CSRP, four primary areas of concern were identified.
- Asia has an Ivy school MBA but does not have an engineering background or degree. Will the Company be able to replace Asa Jr.’s technological and product development know-how?
- Asa Jr. is not a good financial manager and not good at controlling costs. Asia does have these skills and is working to implement changes to improve the financial performance of the Company. Will Asia be successful?
- The work force is highly skilled in building analog devices, but it is aging. While turnover has been low, the workforce is starting to retire. Will the Company be able to find the skilled labor it needs?
- Currently, digital technology cannot match the precision of the Company’s products. However, as digital technology and artificial intelligence (AI) develop, the Company’s products might be replaceable by less costly alternatives.
Implementing the model requires completing the risk assessment three times: one for the most likely scenario, one for the best-case scenario, and one for the worst-case scenario. However, not every attribute considered needs to be changed. For the Company, I identified those attributes with the most uncertainty.
For this article, I am just focusing on these attributes. Different people may come to different conclusions concerning risk. This is a matter of professional judgment. This case study is also being presented for demonstration purposes only.
The starting point is the most likely scenario.
Financial Attributes
- Liquidity: IU 5 X EU 7 = MU 35 (Quick ratio is less than 1, has been declining, below industry average. Current ratio decreasing, below industry average.)
- Profitability: IU 5 X EU 4 = MU 20 (Operating profit has been decreasing.)
- Volatility: IU 5 X EU 4 = MU 10 (Profitability has been somewhat volatile [40%].)
Management Quality and Reliability
- Education and experience: IU 5 X EU 7 = MU 35 (Owner is the primary technical guru for the Company.)
- Succession plan: IU 3 X EU 4 = MU 12 (Daughter is taking over the business; MBA. Worked in company for seven years.)
- Depth of management: Eu 3 X IU 4 = 12 (Daughter does not have any technical or engineering background. There are experienced manufacturing managers.)
Staffing
- Technical skills required: IU 5 X EU4 = MU 20 (Requires a skilled workforce to manufacture product.)
- Turnover: IU 5 X EU 4 = MU 20 (Aging workforce. Starting to retire. Hard to find skilled replacements.)
Market/Product Risks
- Product Obsolescence: IU 3 X EU 2 = MU 6 (Some risk of being replaced by digital technology.)
- Ease of Entry: IU 3 X EU 1 = MU 3 (Highly specialized product requiring special knowledge and manufacturing and testing equipment.)
- Ability to differentiate: IU 5 X EU 2 = MU 10 (Specialized product, not readily available elsewhere.)
Next is the best-case (low risk) scenario. For this, the focus is on the financial attributes, management quality and reliability, and staffing issues.
Financial Attributes
- Liquidity: IU 5 X EU 4 = MU 20 (Quick ratio is less than 1, has been declining, below industry average. Current ratio decreasing, below industry average. Daughter is marketing more heavily to commercial users. Hopes to achieve better liquidity.)
- Profitability: IU 5 X EU 2 = MU 10 (Operating profit has been increasing. Daughter is implementing controls to improve profitability.)
- Volatility: IU 5 X EU 1= MU 5 (Profitability has been somewhat volatile [40%]. Daughter hopes to achieve lower volatility through better management and a greater proportion of commercial customers.)
Management Quality and Reliability
- Education and experience: IU 5 X EU 1 = MU 5 (Owner, son of founder, has all the technical knowledge concerning the product. Assume company is able to bring in a person with necessary knowledge.)
- Succession plan: IU 3 X EU 1 = MU 3 (Daughter is taking over the business; MBA. Worked in company for seven years. Assume daughter is able to successfully manage the business.)
- Depth of management: Eu 3 X IU 2 = 6 (Daughter does not have any technical or engineering background. There are experienced manufacturing managers. Assume daughter brings in person with technical knowledge.)
Staffing
- Technical skills required: IU 5 X EU 2 = MU 10 (Requires a skilled workforce to manufacture product. Daughter implementing training program to train new employees.)
- Turnover: IU 5 X EU 2 = MU 10 (Aging workforce. Starting to retire. Hard to find skilled replacements. Daughter implementing training program to train new employees.)
Finally, we consider the worse-case (high) scenario. The focus is on the market/product issues.
Market/Product Risks
- Product Obsolescence: IU 3 X EU 7 = MU 21 (Some risk of being replaced by digital technology. Increasing sophistication of digital technology and AI could result in digital products replacing this product at a lower cost to produce.)
- Ease of Entry: IU 3 X EU 7 = MU 21 (Highly specialized product requiring special knowledge. If digital technology is able to replace product, then digital contractors can produce product easily.)
- Ability to differentiate: IU 5 X EU 7 = MU 35 (Specialized product, not readily available elsewhere. ould be replaced by digital products with significant price drop.)
The total multiplicative utility is used for each scenario. The following are the inputs for the triangular distribution:
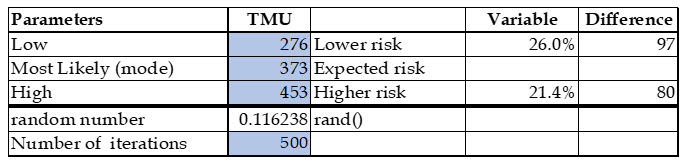
The following is the results of the Monte Carlo simulation with 500 iterations:
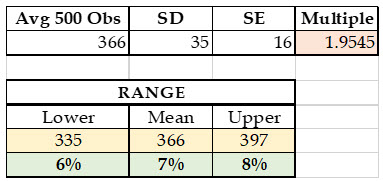
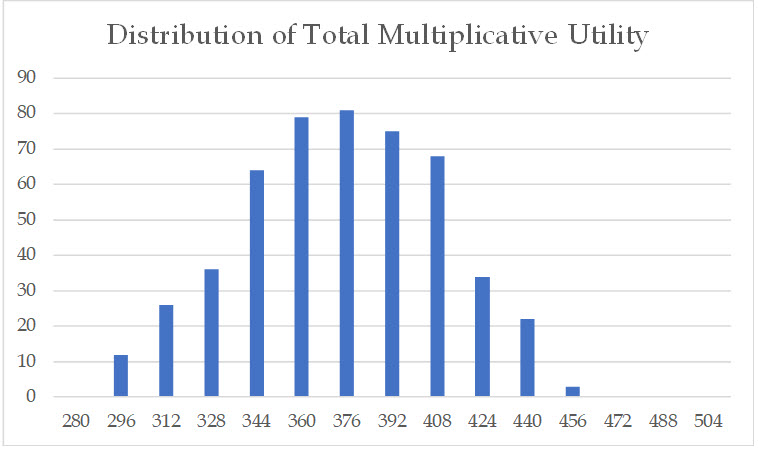
Given the input parameters, there is 5% chance that the range of CSRP falls outside the indicated range of 6%–8% (the range falls within two standard deviations). The chart below shows the distribution of the total multiplicative utilities.
Based on this analysis, a 7% CSRP seems appropriate.
Some Observations
Notice that the difference between the TMU for the low scenario and the most likely scenario is somewhat greater than the difference between the high scenario and the most likely scenario (-26% versus +21%). This results in the Monte Carlo simulation resulting in an average TMU (366) that is less than the TMU for the most likely scenario (373). Both resulting average TMU and most likely scenario TMU fall within the 7% CSRP.
Were the differences between the scenarios symmetrical, the resulting average from the Monte Carlo simulation would be the same or very close to the TMU for the most likely scenario.
This model may be used to test to determine the CSRP or you may use it to test the reasonableness of your CSRP. You can show that there is a 95% certainty that your result will not fall outside of the given range. This neutralizes the nitpicking of individual IU and EU that valuation analysts might be wary of. Remember, this model is intended for the small companies most of us value and is not intended for unusual risk situations.
You may e-mail me for a free Excel workbook incorporating the models discussed in this article and/or a copy of the articles from The Value Examiner.
[1] “A Hybrid Approach to Estimating Company Specific Risk,” The Value Examiner, July/August 2022, pp. 19–23.
[2] “A Hybrid Approach to Determining Company-Specific Risk: Using Monte Carlo Simulation,” The Value Examiner, November/December 2022, pp.12–16.
[3] If you have not read these articles, you should do so to better understand this article.
[4] William A. Hanlin, Jr., and J. Richard Claywell, “The RRCM Alternative: Risk Approach,” in Hitchner, Financial Valuation, Applications and Models, 3rd ed., chap. 6, add. 7.
[5] https://www.investopedia.com/terms/m/montecarlosimulation.asp#:~:text=A%20Monte%20Carlo%20simulation%20is%20a%20model%20used%20to%20predict,in%20prediction%20and%20forecasting%20models.
[6] Ibid.
[7] https://www.investopedia.com/terms/l/loss-psychology.asp.
[8] https://learnandteachstatistics.files.wordpress.com/2013/07/notes-on-triangle-distributions.pdf.
David Goodman, MBA, CPA, CVA, has 25 years of experience in performing business valuations and forensic accounting services for family law and business disputes. He also has prepared business valuations for tax and buy-sell purposes. He has an MBA from the Amos Tuck School at Dartmouth College. He is a past-president of the NACVA-Mass State Chapter, past chair of the Massachusetts Society of Certified Public Accountants Litigation and BV committee, and a past board member and treasurer of the Massachusetts Collaborative Law Council. As a financial neutral, Mr. Goodman has helped divorcing couples reach peaceful equitable solutions. He has presented on business valuation and tax issues related to divorce at NACVA annual conference, NACVA-Mass. State Chapter, and the Massachusetts Collaborative Law Council. He has also testified as an expert witness in court and arbitration. He is currently serving on the editorial board of QuickRead.
Mr. Goodman can be contacted at (617) 698-3950 or by e-mail to dgoodman@joacpa.com.