In Related-Party Cost Sharing Arrangements (Part II of II)
This two-part paper demonstrates how the discount rate associated with the investment in intangibles developed under a cost sharing arrangement can be calculated using an analytical framework that explicitly considers variability of outcomes in profitability of the intangibles to be developed. Such framework is the probability-weighted scenario analysis. The method of calculating discount rates using the scenario analysis can be applied to compute the PCT payment under both the “income method” and the “residual profit split method” described in the U.S. transfer pricing regulations. The same method also allows to calculate compensation of an entity that funds the CSA activities. This paper illustrates application of the proposed technique and provides comparisons with the example of the income method application discussed in the U.S. transfer pricing regulations.

[su_pullquote align=”right”]Resources:
Application of Scenario Analysis for Computing Discount Rates in Related-Party Cost Sharing Arrangements (Part I of II)
[/su_pullquote]
In this second part, the author discusses computing discount rates in Cost Sharing Agreements using the Probability-Weighted Scenario framework, consistency of the Scenario Analysis with the “Licensing Alternative”, and Calculation of the PCT under Scenario Analysis.
5. Computing Discount Rates in Cost Sharing Arrangements Using the Probability-Weighted Scenario Framework
To calculate the discount rate for the intangibles development activities under a CSA, I applied the CAPM framework for the required return on equity.[1] The discount rate obtained using this method is on an after-tax basis. According to the CSA Regulations, in the application of the income method, an after-tax discount rate should be applied to discount after-tax income streams.[2]
According to CAPM theory, an investor in a particular risky asset c is rewarded only for the “systematic” (i.e., market-correlated) risk associated with this asset, which is consistent with the requirement of the CSA Regulations that the discount rates incorporate “market-correlated risks of activities.”[3] Using the CAPM formula, the required rate of return on an investment in a risky asset c can be expressed as follows
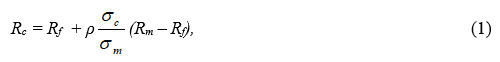
The notation used in formula (1) is as follows: Rc is the required rate of return on a risky asset c; Rf is a risk-free rate; the term (Rm – Rf) denotes the market risk premium, i.e., excess return earned by a market portfolio over a risk-free rate of return; the term ρ is a measure of correlation between the returns of a specific asset c and the returns of a market portfolio; σc represents the volatility of returns on the asset c; σm represents the volatility of the market portfolio, and ρ represents the correlation between the returns on the asset c and returns on the market portfolio. The discount rate calculated in formula (1) is an after-tax rate.
The above formula (1) contains the parameter ρ , which is equivalent to what is known as “beta” in the CAPM model. “Beta” of a company stock can be viewed as a correlation of returns on the market portfolio with returns on all of the assets of the given company (both tangible and intangible) weighted by the proportion of these assets’ contribution to the company’s market value. To calculate the parameter ρ applicable to the intangibles development activities under a CSA, consideration should be given to what part of the company’s portfolio of intangibles will be subject to cost sharing. If the cost sharing arrangement covers most or all of the valuable intangibles owned by the company, then the overall company “beta” would be an appropriate measure of the correlation between the returns on the intangibles developed under a CSA and the market returns.[4] If, on the other hand, only a small proportion of the company’s total pool of (current) intangible assets is subject to further development under the cost sharing arrangement, the use of the company-wide beta is less supportable from the theoretical perspective. The most theoretically sound technique in this case is to quantify the volatility of returns on the investment subject to cost sharing and compute the correlation of this volatility with the volatility of the market portfolio. In the context of the scenario analysis, returns on investment in the intangibles development activities can be computed as the IRR of after-tax residual profits realized in each of the scenarios. The residual profits need to be stated on an after-tax basis to match the after-tax basis of other parameters of the CAPM formula. In this setting, the standard deviation of the IRR outcomes among the scenarios is equivalent to the volatility of return on investment σc. The correlation ρ between the volatility of returns on the cost shared investment and the market volatility σm could be estimated from the data for similar investments in the past. If, however, such estimates prove difficult to implement in practice, the parameter ρ representing correlation between the returns on the given company’s shares and returns on the market portfolio can be estimated from market data and used as a proxy for the correlation between the projected returns on the intangibles subject to CSA and the market return. This solution assumes that the market prices of the company’s shares correctly incorporate the anticipated future profits which, presumably, will be derived, at least in part, from the cost-shared intangibles under development.
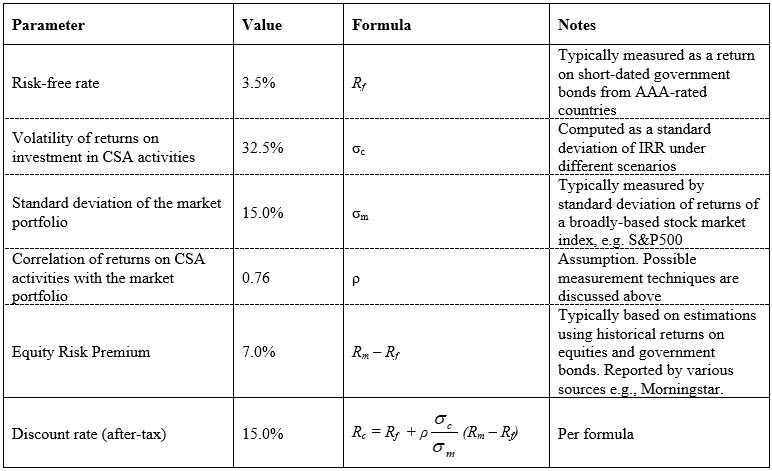
An example illustrating the determination of the risk-adjusted discount rate for the CSA using the results of scenario analysis is provided in Exhibit C. Although this example uses realistic input parameters and indicates the commonly used sources for those inputs, the resulting after-tax discount rate of 15% is deliberately chosen to be the same as the one used in the CSA Regulations Example. This is done to facilitate an easy comparison between of the PCT Payment computed in the CSA Regulations Example with that calculated under the scenario analysis developed in this paper. In general, however, the larger is the standard deviation of IRR computed from the various possible scenarios of the CSA realization, the greater is the discount rate applicable to the CSA alternative, and vice versa.
Exhibit C
Example of the Discount Rate Determination Using the Results of Scenario Analysis
This example demonstrates calculation of a discount rate applicable to the investment in intangibles developed under a CSA using inputs from the scenario analysis and assuming that the CSA activities are funded by equity alone.
Calculation of Sample Properties for Returns on Investment in CSA activities
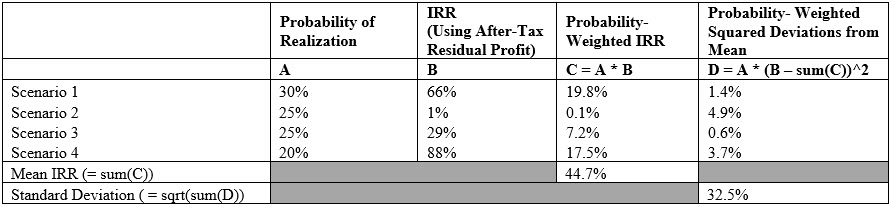
Using the after-tax residual profits calculated in Exhibit B for each of the scenarios (line G), I have computed the internal rates of return for each scenario as shown below and determined the IRR sample mean of 44.7% and the standard deviation of 32.5%.[5]
Mean and Standard Deviation of Internal Rates of Return (IRR) Using Post-Tax Operating Profit
Calculation of the Discount Rate per CAPM Formula
This calculation uses an input for σc from the scenario analysis presented in Exhibit B; the resulting discount rate has been chosen deliberately to be equal to the discount rate applied to the cost sharing alternative in the CSA Regulations Example.
- Consistency of the Scenario Analysis with the “Licensing Alternative”
The core premise of the income method is that the PCT Payment makes the value of the PCT Payor’s profit earned under the CSA equal to the present value of the profit under the licensing alternative. The calculation of the PCT Payment, thus, is a function of the royalty rate paid by the licensee under the licensing scenario. The CSA Regulations discuss two methods of determining the royalty rates for the licensing scenario: one based on the licensing payments observed in comparable unrelated-party transactions (“CUT method”) and the other based on returns on routine activities of comparable licensees (“CPM method”).[6]
Demonstration of consistency of the scenario analysis developed in this paper with the core premise of the income method implying equivalence between the CSA and licensing alternatives is demonstrated in Exhibit D. In this Exhibit, royalty rates for the scenarios are derived using the CPM method and applied to the PCT Payor’s projected cash flows under the licensing alternative. For each scenario, the royalty rates under the licensing alternative are calculated as a ratio of present values of pre-IDC residual profits to present values of sales for the PCT Payor. Because compensation of the PCT Payor’s contribution does not include compensation for platform intangibles, PCT Payor by construction will earn zero residual profit. This property of the scenario analysis framework confirms its consistency with the core premise of the income method.
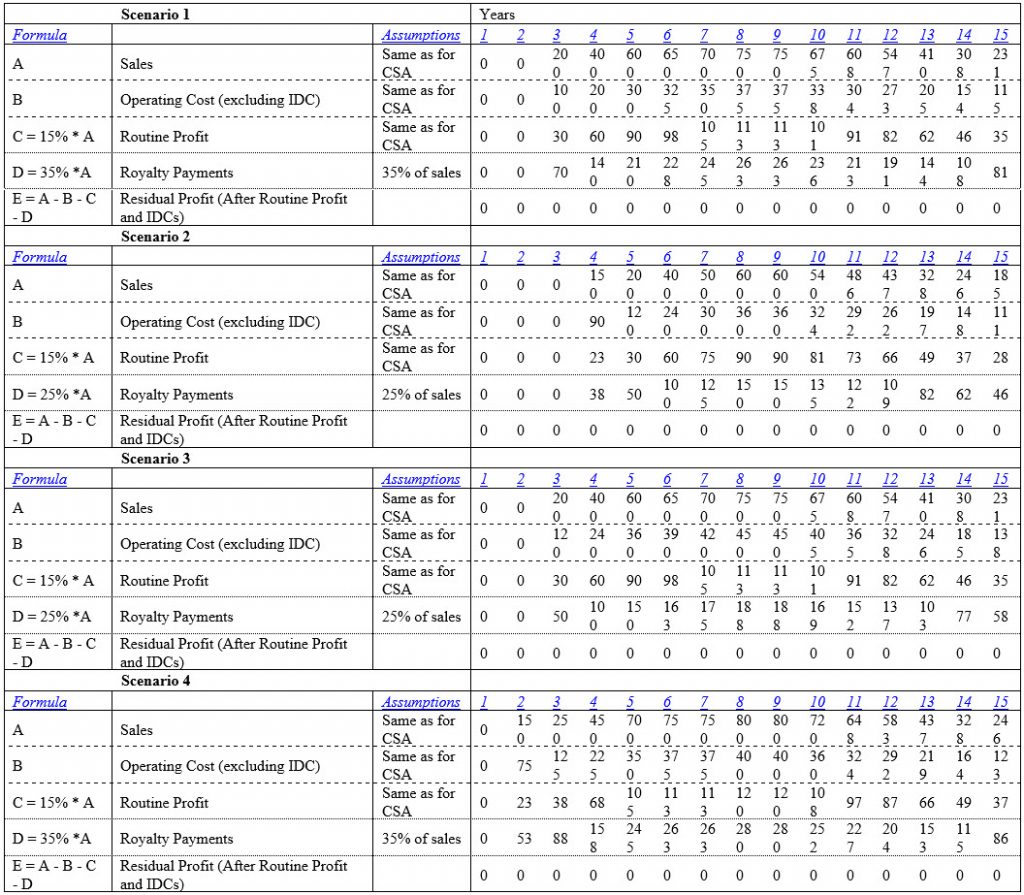
Exhibit D.
The Licensing Alternative Under the Scenario Analysis
An assumption made in Exhibit B segregates the total profit of FS earned under the CSA alternative between the compensation for the FS routine contributions and the residual profit. This assumption allows to calculate the pre-IDC residual profits for each scenario. The royalty rates for each scenario are obtained by dividing the present values of pre-IDC residual profits by the present values of sales. Consistent with the CSA Regulations Example, the discount rate applied to the pre-IDC residual profits and sales is 15% as per the cost sharing alternative.
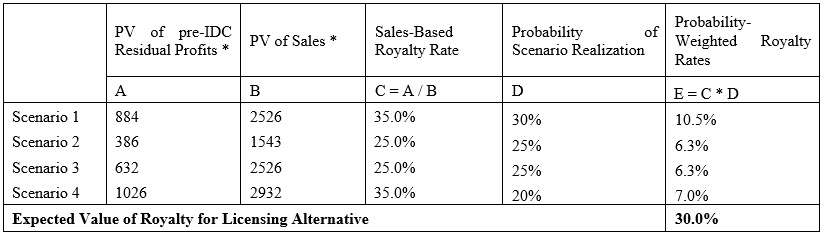
* The discount rate used in the calculation of present values is 15%.
The royalty calculated in the Scenario 1, which replicates the CSA Regulations Example matches the royalty presented in that example; however, the expected value of the royalty considering all of the scenarios is 30% of revenue, i.e., lower than in the base case. The main reason for this result is the fact that the probability-weighted present value of the pre-IDC residual profit under these scenarios is lower than in the base case.
The royalties calculated above were applied to the corresponding scenarios under the licensing alternative. Under the licensing alternative, projections for revenues, operating costs (excluding IDC), and routine profits are the same as in the corresponding CSA scenarios. The licensee is assumed to pay the sales-based royalty at a fixed rate that corresponds to each scenario. Cash flows for each scenario under the licensing alternative are presented below.
It can be seen that the residual profits obtained by FS in each of licensing scenarios are zero, which is consistent with the core premise of the income method.
- Calculation of PCT Under the Scenario Analysis
Under the income method, the PCT Payment is determined as the difference between the present values of operating profit of the PCT Payor under the CSA and licensing alternatives. Calculation of the PCT Payment under the scenario framework relies on the same approach to derive PCTs for each of the scenarios and then compute the expected value of PCT for the CSA after weighing each scenario by the probability of its realization.
In general, the value of the PCT Payment under the scenario analysis will be different from the PCT Payment calculated using only one set of projections because the differences in present values of various cash flows are likely to arise between the two models, and the discount rates used to discount the CSA alternative may be different as well.
The calculation of the PCT Payment for the scenarios developed in this paper is presented in Exhibit E. The PCT Payment of $231 million calculated under the scenario framework is approximately 50% lower than the PCT Payment computed in the CSA Regulations Example (i.e., $464 million), despite using the same discount rate. This difference is a result of two factors:
First, of the four scenarios for the CSA activity developed in this paper, two contemplate a lower-than-the-base-case profitability of intangibles being developed and one projects a higher-than-the-base-case profitability. Taken together, these four scenarios result in a lower probability-weighted amount of operating profit for the PCT Payor’s CSA activities than the base case (see Exhibit B).
Second, the present value of the licensor’s operating profit under the licensing alternative remains relatively more stable in various scenarios due to the fixed rate of return on the licensee’s activities. This means that if the intangibles development process results in realization of intangibles with lower-than-expected profitability, the residual profit available to the platform contributor will be significantly lower. This outcome is observed in two of the four scenarios developed in this paper.
Exhibit E
Value of the PCT Payment Under the Scenario Framework
The value of the PCT Payment under the scenario framework was calculated as the probability-weighted result of PCT Payments obtained in each scenario. For each scenario, the PCT Payment was obtained as a difference between the present value of the FS operating profit under the cost sharing alternative (Exhibit B, line D) and the present value of the FS operating profit under the licensing alternative (Exhibit D, line C). Consistent with the CSA Regulations Example, the discount rate applied to the cash flows for the cost sharing alternative is 15%, and the discount rate applied to the cash flows for the licensing alternative is 13%.
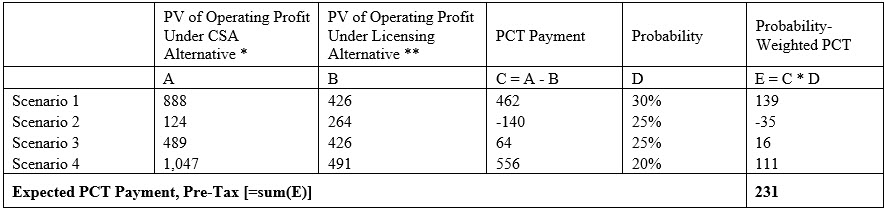
* The discount rate used in the calculation of present value under the CSA alternative is 15%. The discounted value of operating profit in Scenario 1 does not reconcile with that in the CSA Regulations Example due to the slight variance in the discount rate.
** The discount rate used in the calculation of present value under the CSA alternative is 13%.
The PCT Payment calculated under the scenarios presented in this paper ($231 million) is materially lower than the PCT Payment calculated in the CSA Regulations Example ($464 million).
Concluding Remarks
Although this paper demonstrates the calculation of discount rate for the intangible development activities in the case when only one party to the CSA contributes platform intangibles, the scenario analysis framework proposed here can be extended to accommodate the situation when the platform contribution is provided by more than one CSA participant. Therefore, the method discussed in this paper is applicable either in the case when the best method to determine the PCT Payments is the “income method” or the “residual profit split” as those methods are described in the CSA Regulations. Additionally, the method of calculating the discount rate applicable to intangibles development activities using the scenario analysis presented in this paper can be applied to derive the compensation of an entity that funds the CSA activities.
Probability-weighted scenario analysis is a useful technique for estimating the discount rate to be applied in intangible development situations that involve self-developed intangibles, particularly when development costs of such intangibles are shared at a relatively early stage at which the intangibles’ profit potential is highly uncertain. The scenario framework may be superior to a single set of projections as it allows to explicitly model outcomes under different future realizations of revenues from the intangibles, intangible development costs, and other parameters of the CSA activity.
The method for discount rate determination based on the probability-weighted scenario analysis discussed in this paper satisfies the requirements described in the U.S. Cost Sharing Regulations because its premises are consistent with the premises of the income method. Under the scenario framework, discount rates applicable to the cost sharing alternative can be derived directly using the scenarios constructed which allows to account for the risks associated with specific and unique intangibles subject to the CSA, incorporate correlation between returns on the CSA activities and market returns on other assets, and to avoid reliance on imperfect comparables that conduct development of other intangibles.
Because the risk associated with the intangibles development activities is taken into account explicitly in calculation of the discount rate under the scenario analysis framework, discount rates computed using this method may be materially different from those computed under a single set of projections for the CSA activities. Additionally, the PCT Payments computed using the scenario analysis can be materially different from the PCT Payments computed under a single set of projections.
The scenario analysis discussed in this paper is illustrated with numerical exhibits designed to track one of the examples of the income method application developed in the CSA Regulations. It demonstrates that despite a deliberate choice of a discount rate identical to the one used in the CSA Regulations Example, the PCT Payment computed under the scenario analysis can be materially different from the result obtained under the CSA Regulations.
By explicitly considering possible multiple outcomes of intangible development activities using scenario analysis, taxpayers may better prepare themselves for the scrutiny of their cost sharing arrangements by tax authorities who typically examine outcomes of these arrangements after the fact.
Reproduced with permission from Tax Management Transfer Pricing Report, Vol. 24 No. 4, 6/25/2015. Copyright 2015 by The Bureau of National Affairs, Inc.; (800) 372-1033; http://www.bna.com
Dr. Vladimir Starkov is a vice president at NERA Economic Consulting. The author would like to thank Harlow Higinbotham and Patrick Breslin for their review and helpful comments. Any remaining errors are author’s own. The views and opinions presented in this paper are those of the author and not of NERA Economic Consulting.
Dr Vladimir Starkov is an economist and a testifying expert specializing in transfer pricing and asset valuation. He has provided consulting services for multinational companies, closely held businesses, tax authorities, attorneys, and other clients. His experience encompasses a variety of industries, including AgroSciences, automotive, banking, biotechnology, high technology, consumer electronics, manufacturing of consumer and industrial products, electric utilities, pharmaceuticals, petrochemicals, retail, and others.
Dr. Starkov has participated in engagements involving various tax controversy proceedings, including negotiation and implementation support for unilateral and multilateral Advance Pricing Agreements (APA) with tax authorities in North America, Asia, and Europe, design of intercompany pricing methodologies, valuation of intangible property transferred in intercompany transactions, including cost sharing arrangements, and preparation of transfer pricing documentation, including master files and local files for different jurisdictions. Dr. Starkov has conducted business valuation and valuation of intangible assets held by multinational businesses. He analyzed stock option compensation and consulted on strengthening banks’ internal controls. Dr. Starkov has submitted policy advice to the Organization for Economic Co-operation and Development (OECD) on various aspects of transfer pricing rules and testified at OECD public consultation meetings. Over the course of his career, Dr. Starkov has authored whitepapers and bylined articles, and delivered speeches on various topics related to the valuation of intangibles and transfer pricing.
Dr. Starkov holds a PhD and MA in economics from West Virginia University, and an MS in environmental engineering from Mendeleyev University of Chemical Technology, Russia.
Dr. Starkov holds CVA and MAFF credentials from the National Association of Certified Valuators and Analysts (NACVA).
Dr. Starkov can be contacted at (312) 573-2806 or by e-mail to Vladimir.Starkov@NERA.com.
[1] Because development of new intangibles is typically funded by equity, it may be reasonable to consider only the return on equity in calculation of the discount rate for the CSA activity.
[2] §1.472-7(g)(2)(v)(B)(4).
[3] §1.482-7(g)(2)(v).
[4] For privately held companies, the relevant “beta” can be calculated using the betas from a sample of the comparable publicly traded companies appropriately re-levered to reflect the subject company’s capital structure.
[5] Formulas for the mean and the standard deviation of a discrete variable distribution can be found in many statistics textbooks. See, for example, D.A. Lind, W.G. Marchal, S.A. Wathen “Statistical Techniques in Business & Economics”, McGraw-Hill Irwin, 14th ed., Ch.6.
[6] See §1.482-7(g)(4)(iii).