Keys to Effective Presentation: Graphical Illustration of Quantitative Data
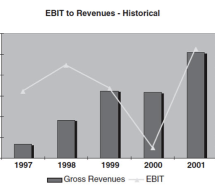
How to graphically illustrate ratio analysis as a way to enhance and simplify summary findings. A key to providing clients with effective valuation reports—and persuading jurors as an expert witness—is the ability to provide quantitative analysis in a compelling visual fashion. Here, Greg Gadawski and Darrell Dorrell provide an example of how to graphically illustrate ratio analysis as a way to enhance and ...
Read more ›

